6.15 apply 族
| 函数 | 输入 | 输出 |
|---|---|---|
apply() |
矩阵、数据框 | 向量 |
lapply() |
向量、列表 | 列表 |
sapply() |
向量、列表 | 向量、矩阵 |
mapply() |
多个向量 | 列表 |
tapply() |
数据框、数组 | 向量 |
vapply() |
列表 | 矩阵 |
eapply() |
列表 | 列表 |
rapply() |
嵌套列表 | 嵌套列表 |
除此之外,还有 dendrapply() 专门处理层次聚类或分类回归树型结构, 而函数 kernapply() 用于时间序列的平滑处理
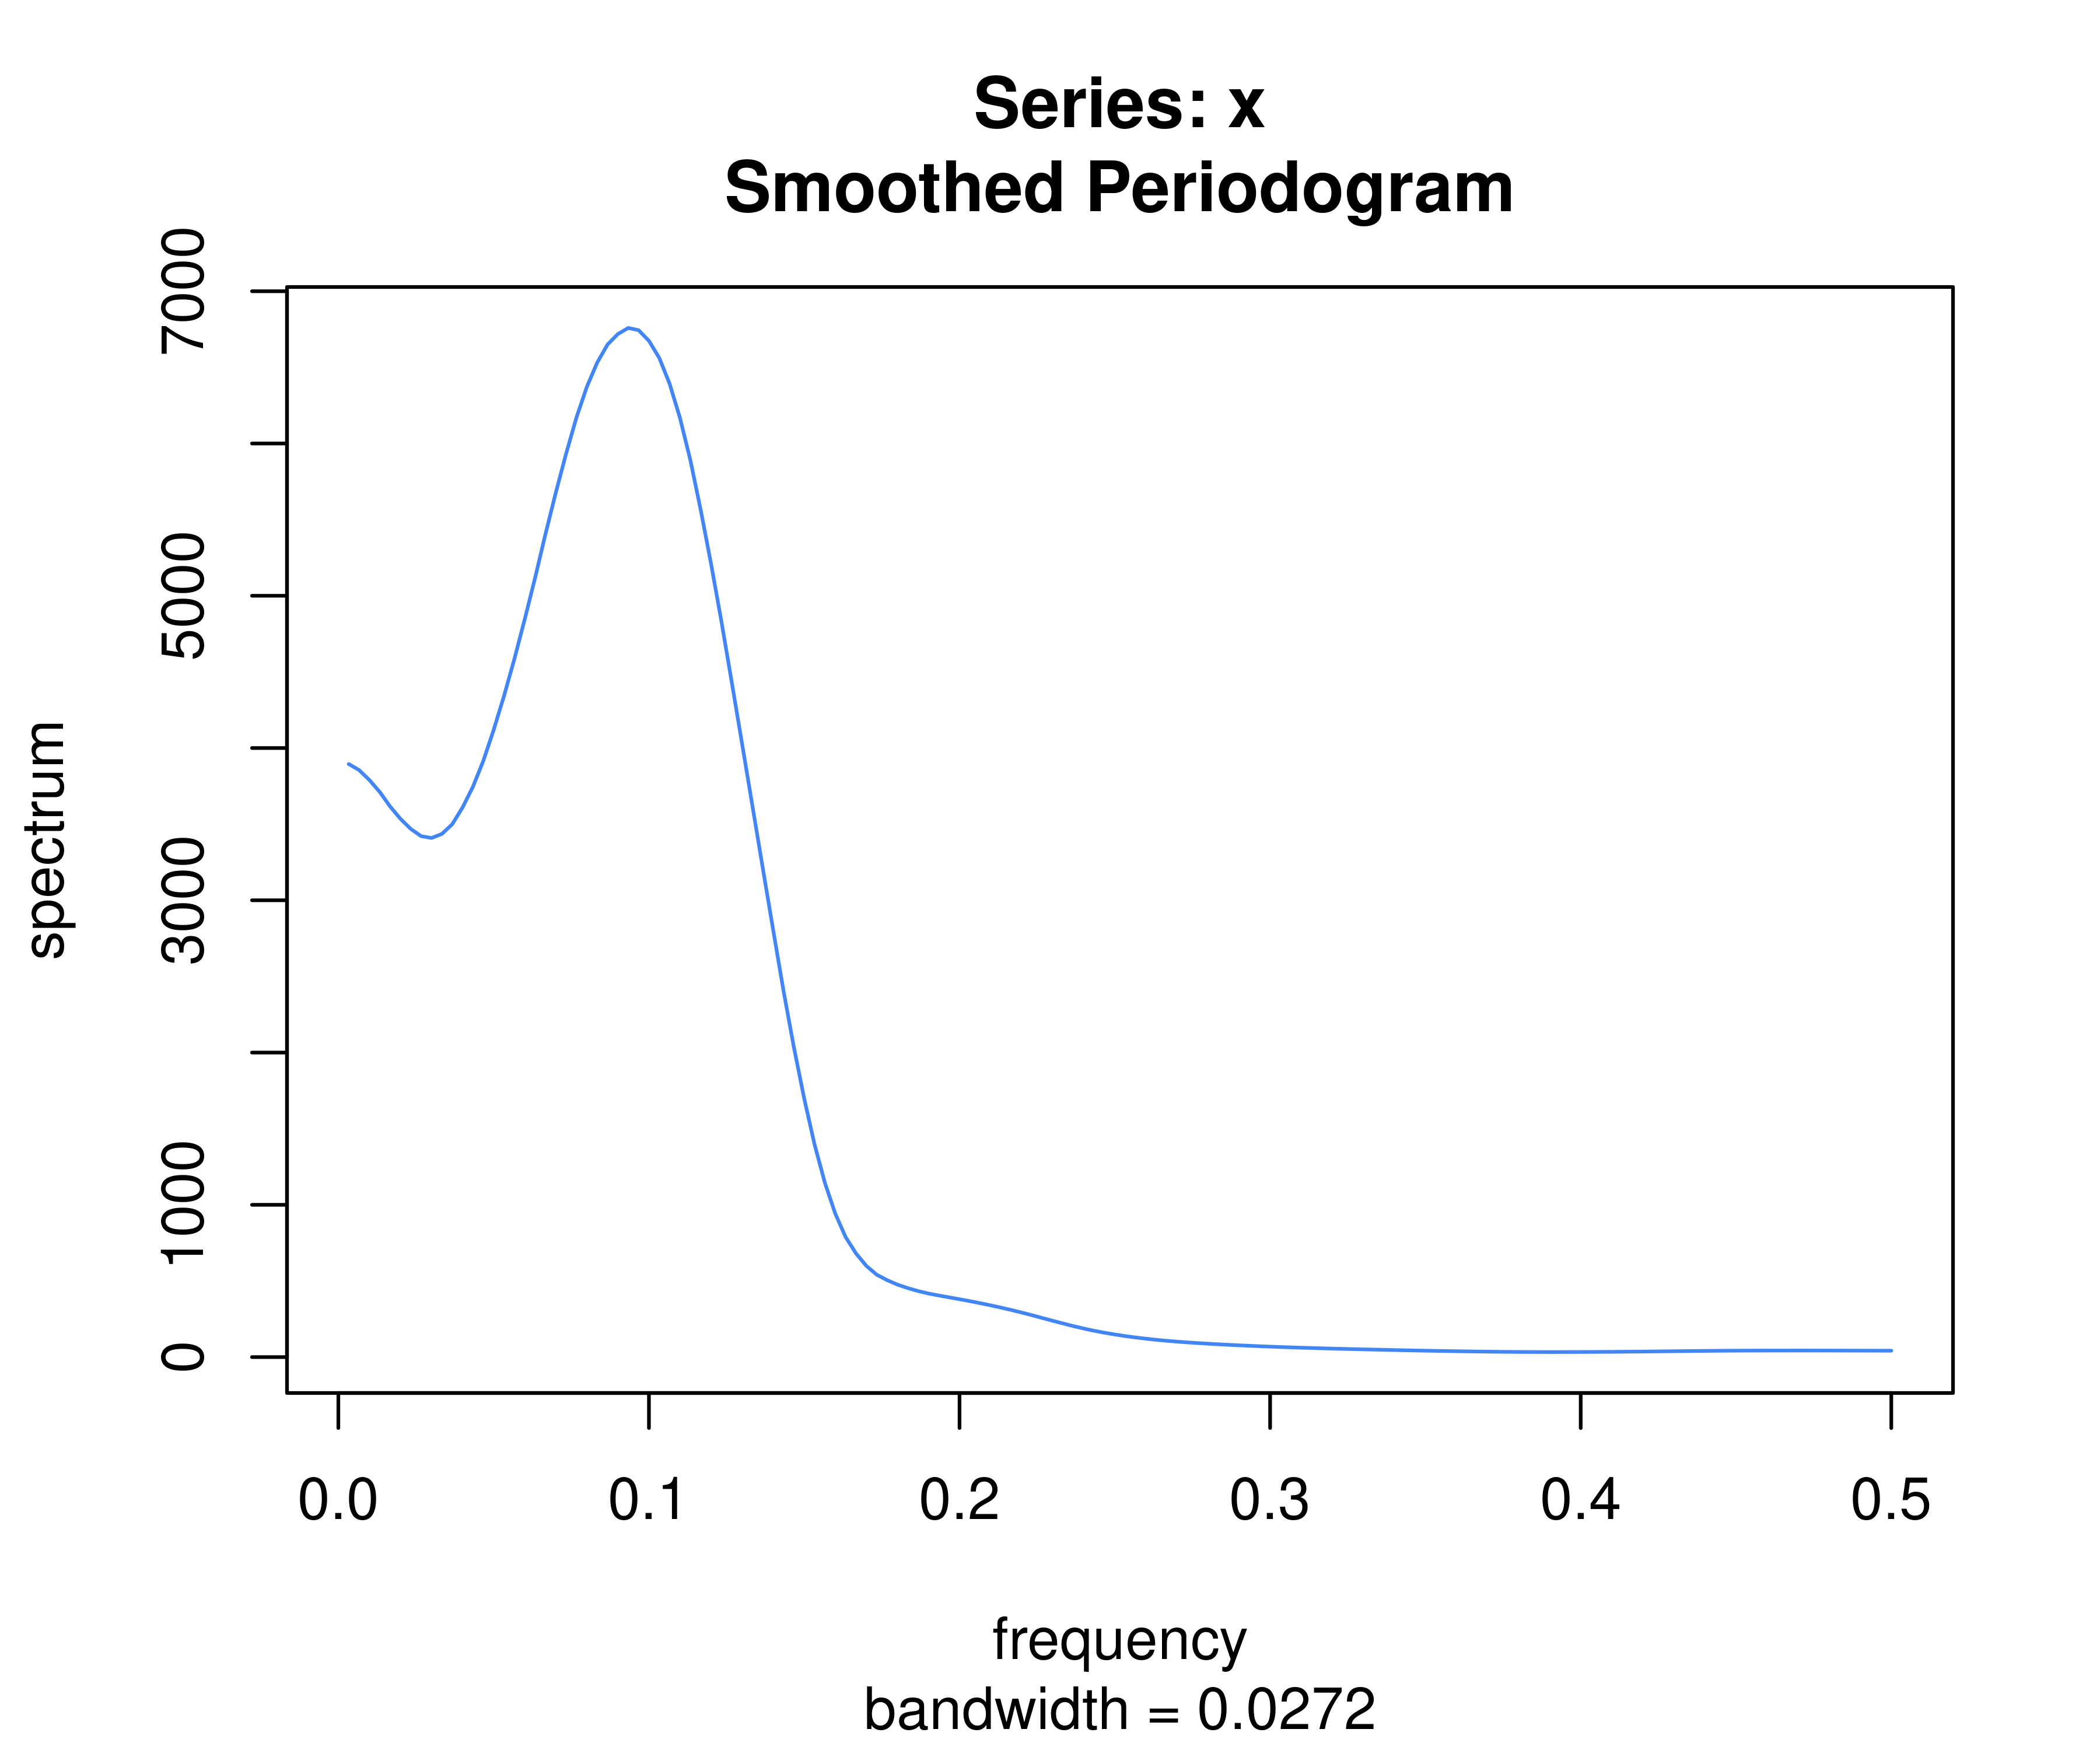
# Reproduce example 10.4.3 from Brockwell and Davis (1991) [@Brockwell_1991_Time]
spectrum(sunspot.year, kernel = kernel("daniell", c(11, 7, 3)), log = "no")
图 6.3: 太阳黑子的频谱
将函数应用到多个向量,返回一个列表,生成四组服从正态分布 \(\mathcal{N}(\mu_i,\sigma_i)\) 的随机数,它们的均值和方差依次是 \(\mu_i = \sigma_i = 1 \ldots 4\)
means <- 1:4
sds <- 1:4
set.seed(2020)
samples <- mapply(rnorm,
  mean = means, sd = sds,
  MoreArgs = list(n = 10), SIMPLIFY = FALSE
)
samples
## [[1]]
## [1] 1.37697212 1.30154837 -0.09802317 -0.13040590 -1.79653432 1.72057350
## [7] 1.93912102 0.77062225 2.75913135 1.11736679
##
## [[2]]
## [1] 0.2937544 3.8185184 4.3927459 1.2568322 1.7534795 5.6000862
## [7] 5.4079918 -4.0775292 -2.5779499 2.1166070
##
## [[3]]
## [1] 9.523096 6.294548 3.954661 2.780557 5.502806 3.596252 6.893524 5.810155
## [9] 2.557700 3.331296
##
## [[4]]
## [1] 0.7499813 1.0251913 8.3813803 13.7414948 5.5524739 5.1625107
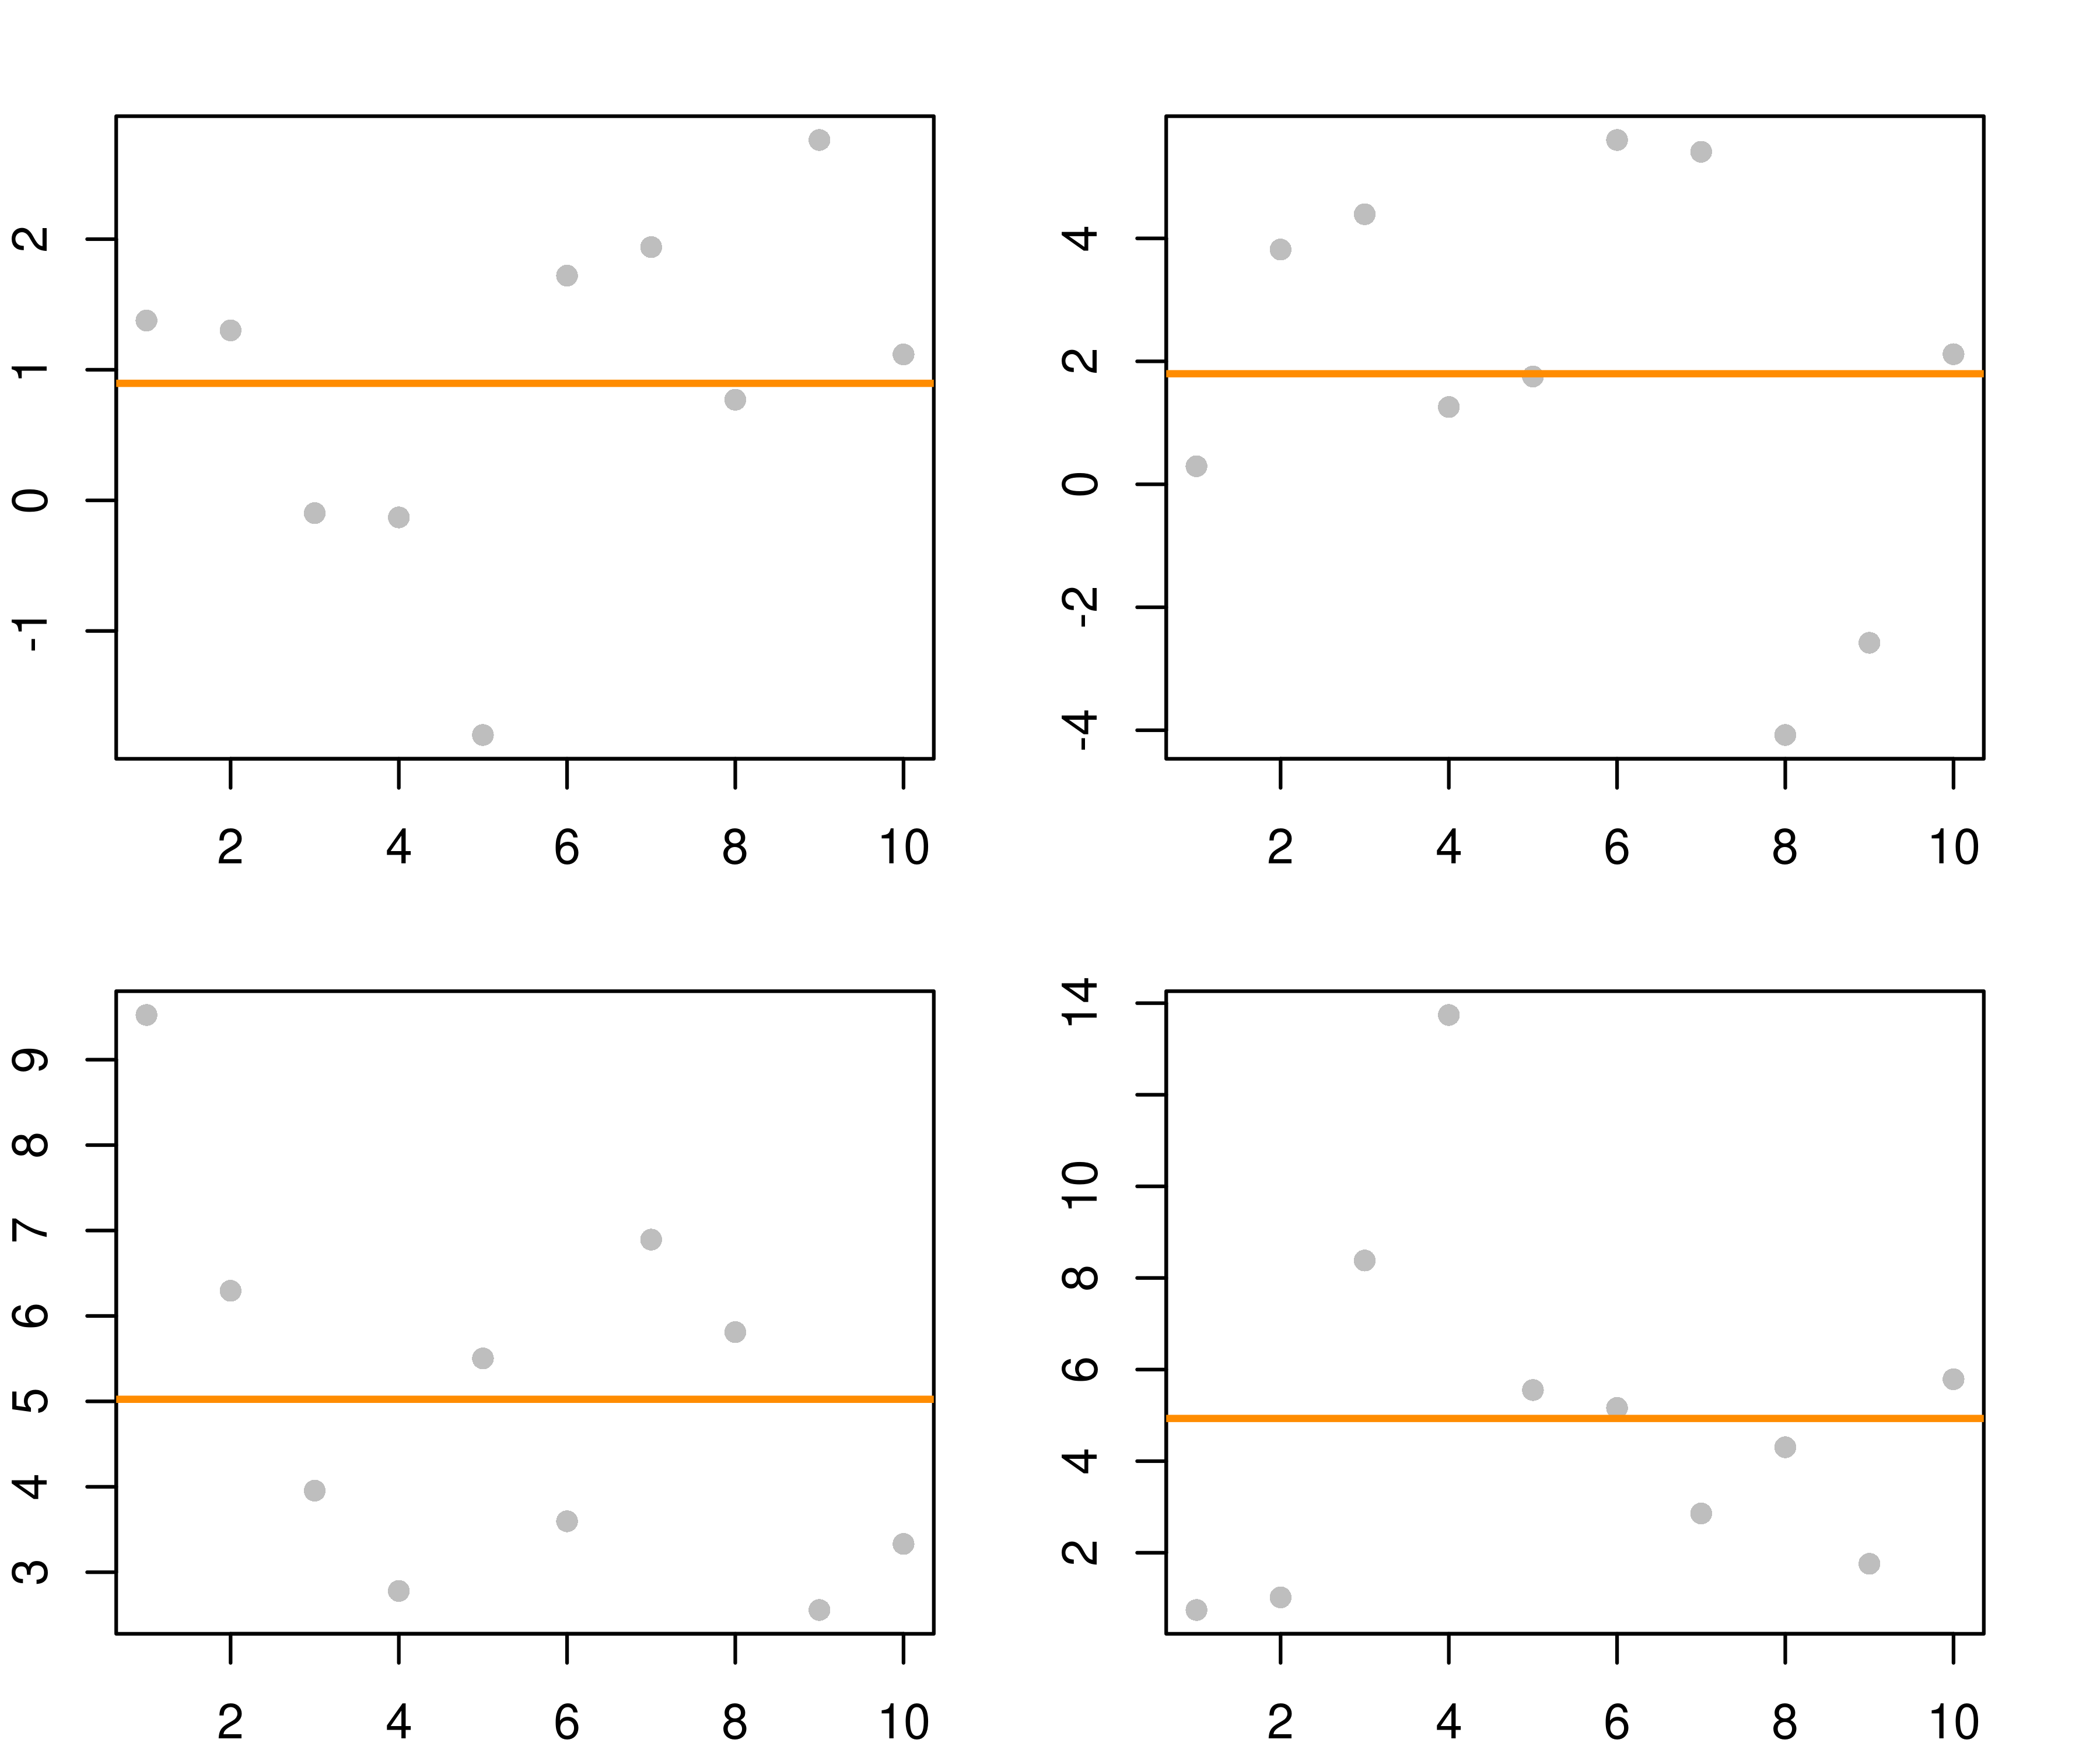
## [7] 2.8576069 4.3040589 1.7588056 5.7887535我们借用图6.4来看一下 mapply 的效果,多组随机数生成非常有助于快速模拟。
par(mfrow = c(2, 2), mar = c(2, 2, 2, 2))
invisible(lapply(samples, function(x) {
  plot(x, pch = 16, col = "grey")
  abline(h = mean(x), lwd = 2, col = "darkorange")
}))
图 6.4: lapply 函数
分别计算每个样本的平均值
sapply(samples, mean)## [1] 0.8960372 1.7984536 5.0244596 4.9322257分别计算每个样本的1,2,3 分位点
lapply(samples, quantile, probs = 1:3 / 4)## [[1]]
## 25% 50% 75%
## 0.1191382 1.2094576 1.6346732
##
## [[2]]
## 25% 50% 75%
## 0.5345238 1.9350433 4.2491890
##
## [[3]]
## 25% 50% 75%
## 3.397535 4.728734 6.173450
##
## [[4]]
## 25% 50% 75%
## 2.033506 4.733285 5.729684仅用 sapply() 函数替换上面的 lapply(),我们可以得到一个矩阵,值得注意的是函数 quantile() 和 fivenum() 算出来的结果有一些差异
sapply(samples, quantile, probs = 1:3 / 4)## [,1] [,2] [,3] [,4]
## 25% 0.1191382 0.5345238 3.397535 2.033506
## 50% 1.2094576 1.9350433 4.728734 4.733285
## 75% 1.6346732 4.2491890 6.173450 5.729684vapply(samples, fivenum, c(Min. = 0, "1st Qu." = 0, Median = 0, "3rd Qu." = 0, Max. = 0))## [,1] [,2] [,3] [,4]
## Min. -1.79653432 -4.0775292 2.557700 0.7499813
## 1st Qu. -0.09802317 0.2937544 3.331296 1.7588056
## Median 1.20945758 1.9350433 4.728734 4.7332848
## 3rd Qu. 1.72057350 4.3927459 6.294548 5.7887535
## Max. 2.75913135 5.6000862 9.523096 13.7414948vapply 和 sapply 类似,但是预先指定返回值类型,这样可以更加安全,有时也更快。
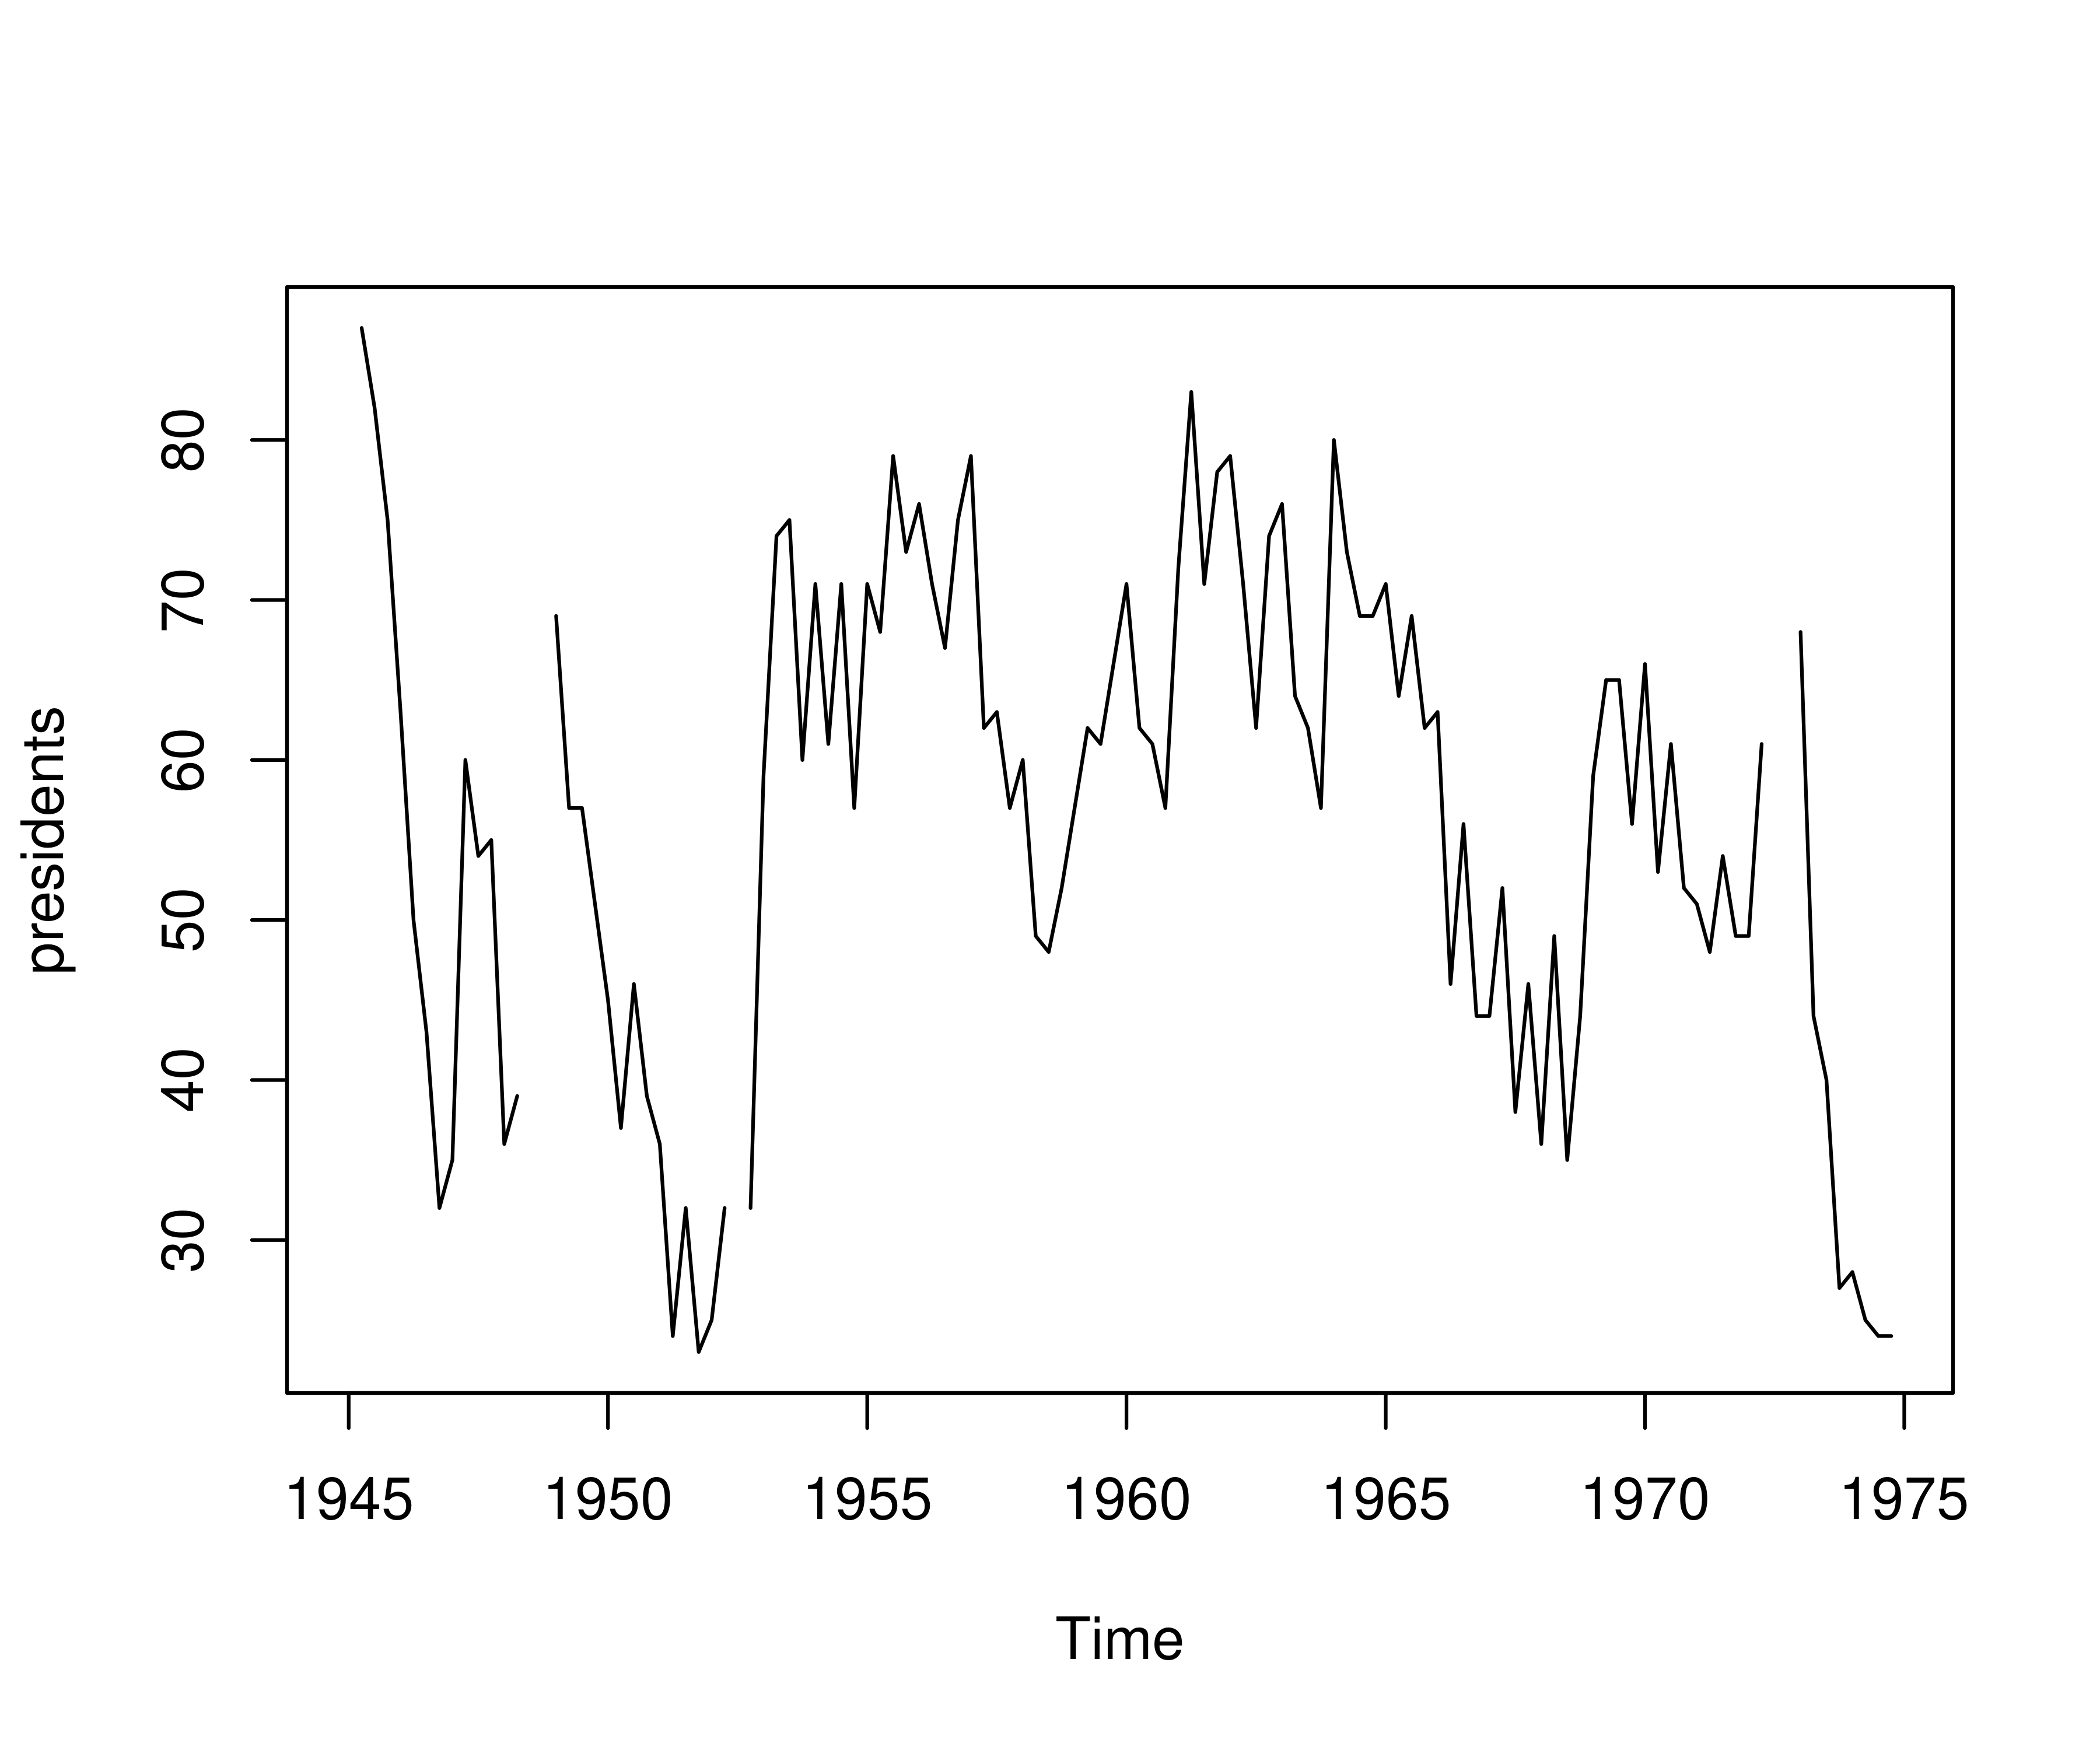
以数据集 presidents 为例,它是一个 ts 对象类型的时间序列数据,记录了 1945 年至 1974 年每个季度美国总统的支持率,这组数据中存在缺失值,以 NA 表示。支持率的变化趋势见图 6.5。
plot(presidents)
图 6.5: 1945-1974美国总统的支持率
计算这 30 年每个季度的平均支持率
tapply(presidents, cycle(presidents), mean, na.rm = TRUE)## 1 2 3 4
## 58.44828 56.43333 57.22222 53.07143cycle() 函数计算序列中每个观察值在周期中的位置,presidents 的周期为 4,根据位置划分组,然后分组求平均,也可以化作如下计算步骤,虽然看起来复杂,但是数据操作的过程很清晰,不再看起来像是一个黑箱。
tapply 函数来做分组求和
# 一个变量分组求和
tapply(warpbreaks$breaks, warpbreaks[, 3, drop = FALSE], sum)
## tension
## L M H
## 655 475 390# 两个变量分组计数
with(warpbreaks, table(wool, tension))## tension
## wool L M H
## A 9 9 9
## B 9 9 9# 两个变量分组求和
dat <- aggregate(breaks ~ wool + tension, data = warpbreaks, sum) |>
reshape(v.names = "breaks", idvar = "wool", timevar = "tension", direction = "wide", sep = "")
`colnames<-`(dat, gsub(pattern = "(breaks)", x = colnames(dat), replacement = ""))## wool L M H
## 1 A 401 216 221
## 2 B 254 259 169