11.1 调色板
R 预置的灰色有224种,挑出其中的调色板
grep("^gr(a|e)y", grep("gr(a|e)y", colors(), value = TRUE),
     value = TRUE, invert = TRUE)
## [1] "darkgray" "darkgrey" "darkslategray" "darkslategray1"
## [5] "darkslategray2" "darkslategray3" "darkslategray4" "darkslategrey"
## [9] "dimgray" "dimgrey" "lightgray" "lightgrey"
## [13] "lightslategray" "lightslategrey" "slategray" "slategray1"
## [17] "slategray2" "slategray3" "slategray4" "slategrey"gray_colors <- paste0(rep(c("slategray", "darkslategray"), each = 4), seq(4))
barplot(1:8, col = gray_colors, border = NA)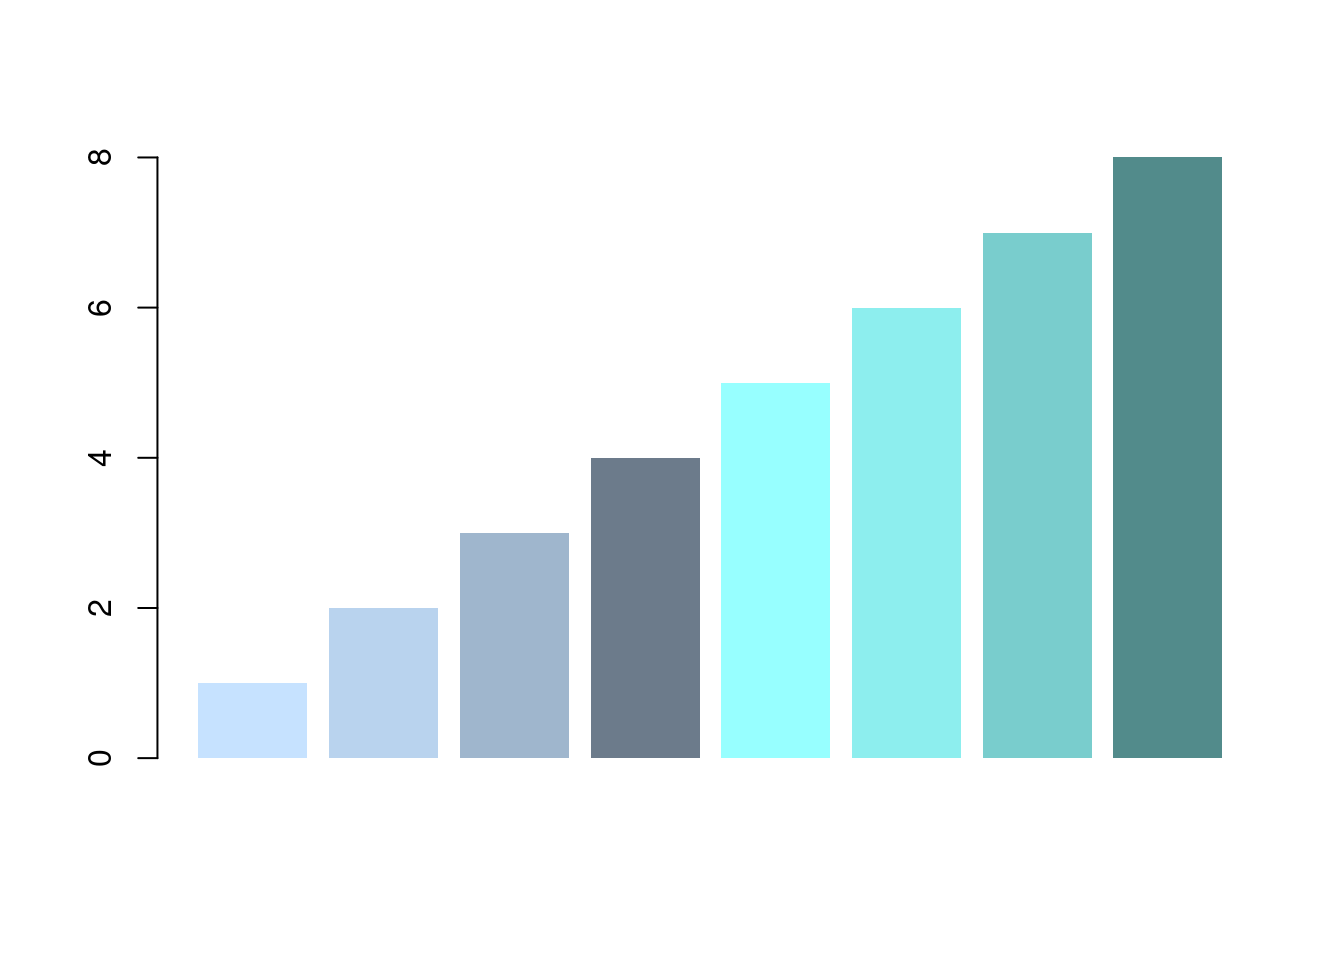
图 11.4: 灰度调色板
gray 与 grey 是一样的,类似 color 和 colour 的关系,可能是美式和英式英语的差别,且看
all.equal(
  col2rgb(paste0("gray", seq(100))),
  col2rgb(paste0("grey", seq(100)))
)
## [1] TRUEgray100 代表白色,gray0 代表黑色,提取灰色调色板,去掉首尾部分是必要的
barplot(1:8,
  col = gray.colors(8, start = .3, end = .9),
  main = "gray.colors function", border = NA
)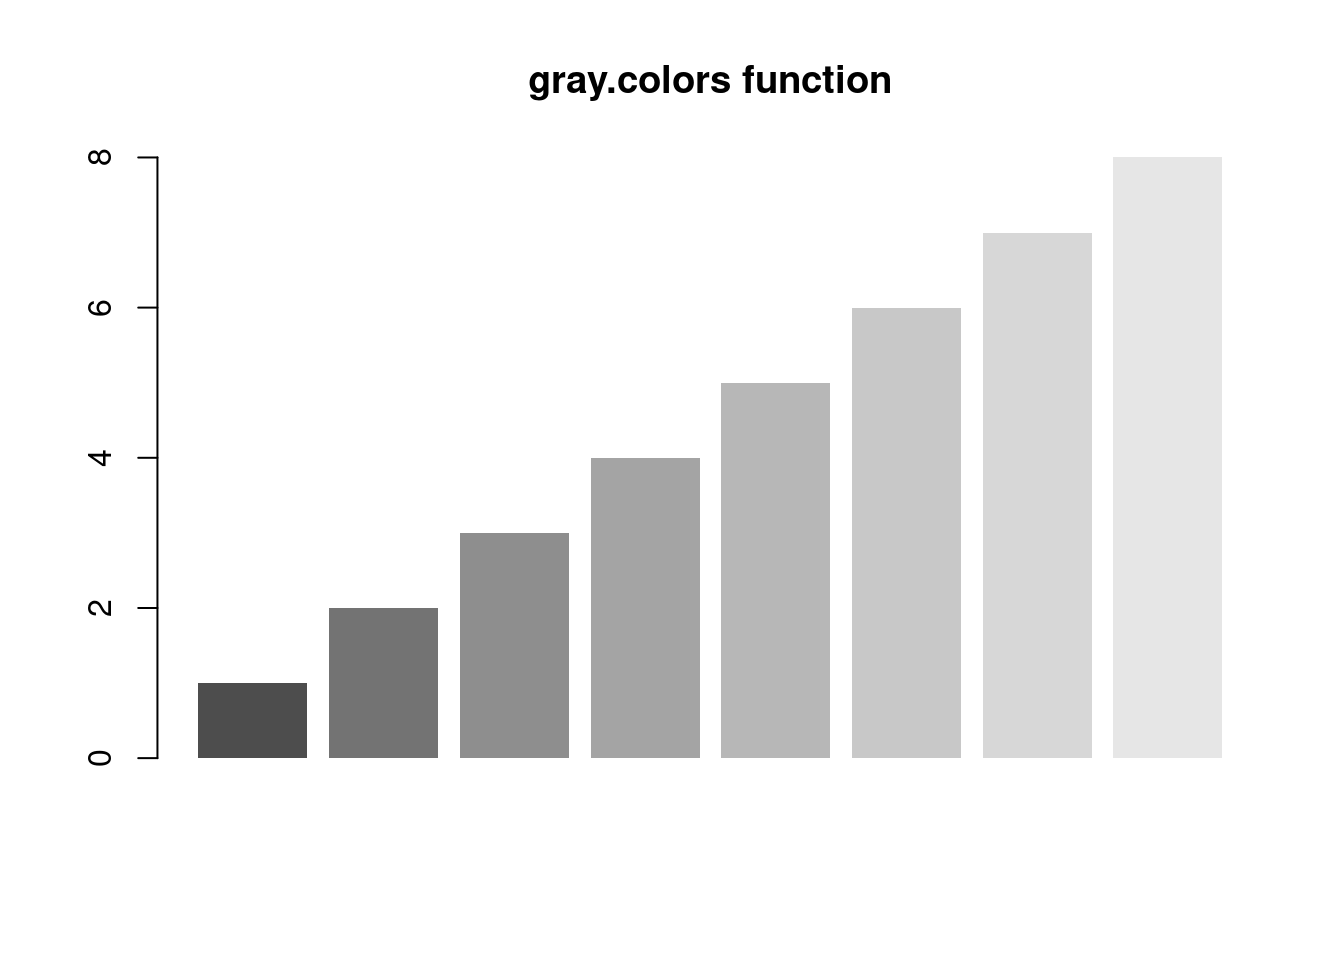
图 11.5: 提取 10 种灰色做调色板
首先选择一组合适的颜色,比如从桃色到梨色,选择6种颜色,以此为基础,可以借助 grDevices::colorRampPalette() 函数扩充至想要的数目,用 graphics::rect() 函数预览这组颜色配制的调色板
# Colors from https://github.com/johannesbjork/LaCroixColoR
colors_vec <- c("#FF3200", "#E9A17C", "#E9E4A6",
                "#1BB6AF", "#0076BB", "#172869")
# 代码来自 ?colorspace::rainbow_hcl
pal <- function(n = 20, colors = colors, border = "light gray", ...) {
  colorname <- (grDevices::colorRampPalette(colors))(n)
  plot(0, 0,
    type = "n", xlim = c(0, 1), ylim = c(0, 1),
    axes = FALSE, ...
  )
  rect(0:(n - 1) / n, 0, 1:n / n, 1, col = colorname, border = border)
}
par(mar = rep(0, 4))
pal(n = 20, colors = colors_vec, xlab = "Colors from Peach to Pear", ylab = "")
图 11.6: 桃色至梨色的渐变
colorRampPalette() 自制调色板
create_palette <- function(n = 1000, colors = c("blue", "orangeRed")) {
  color_palette <- colorRampPalette(colors)(n)
  barplot(rep(1, times = n), col = color_palette,
          border = color_palette, axes = FALSE)
}
par(mfrow = c(3, 1), mar = c(0.1, 0.1, 0.5, 0.1), xaxs = "i", yaxs = "i")
create_palette(n = 1000, colors = c("blue", "orangeRed"))
create_palette(n = 1000, colors = c("darkgreen", "yellow", "orangered"))
create_palette(n = 1000, colors = c("blue", "white", "orangered"))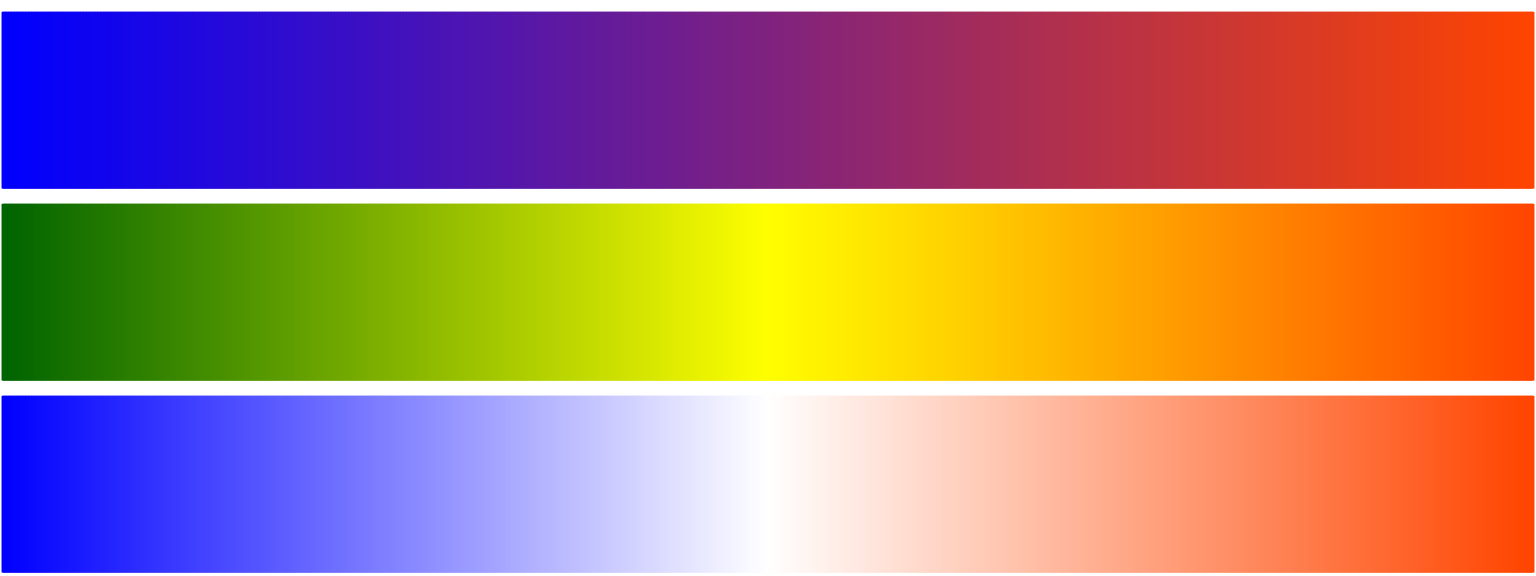
图 11.7: colorRampPalette 自制调色板
par(mar = c(0, 4, 0, 0))
RColorBrewer::display.brewer.all()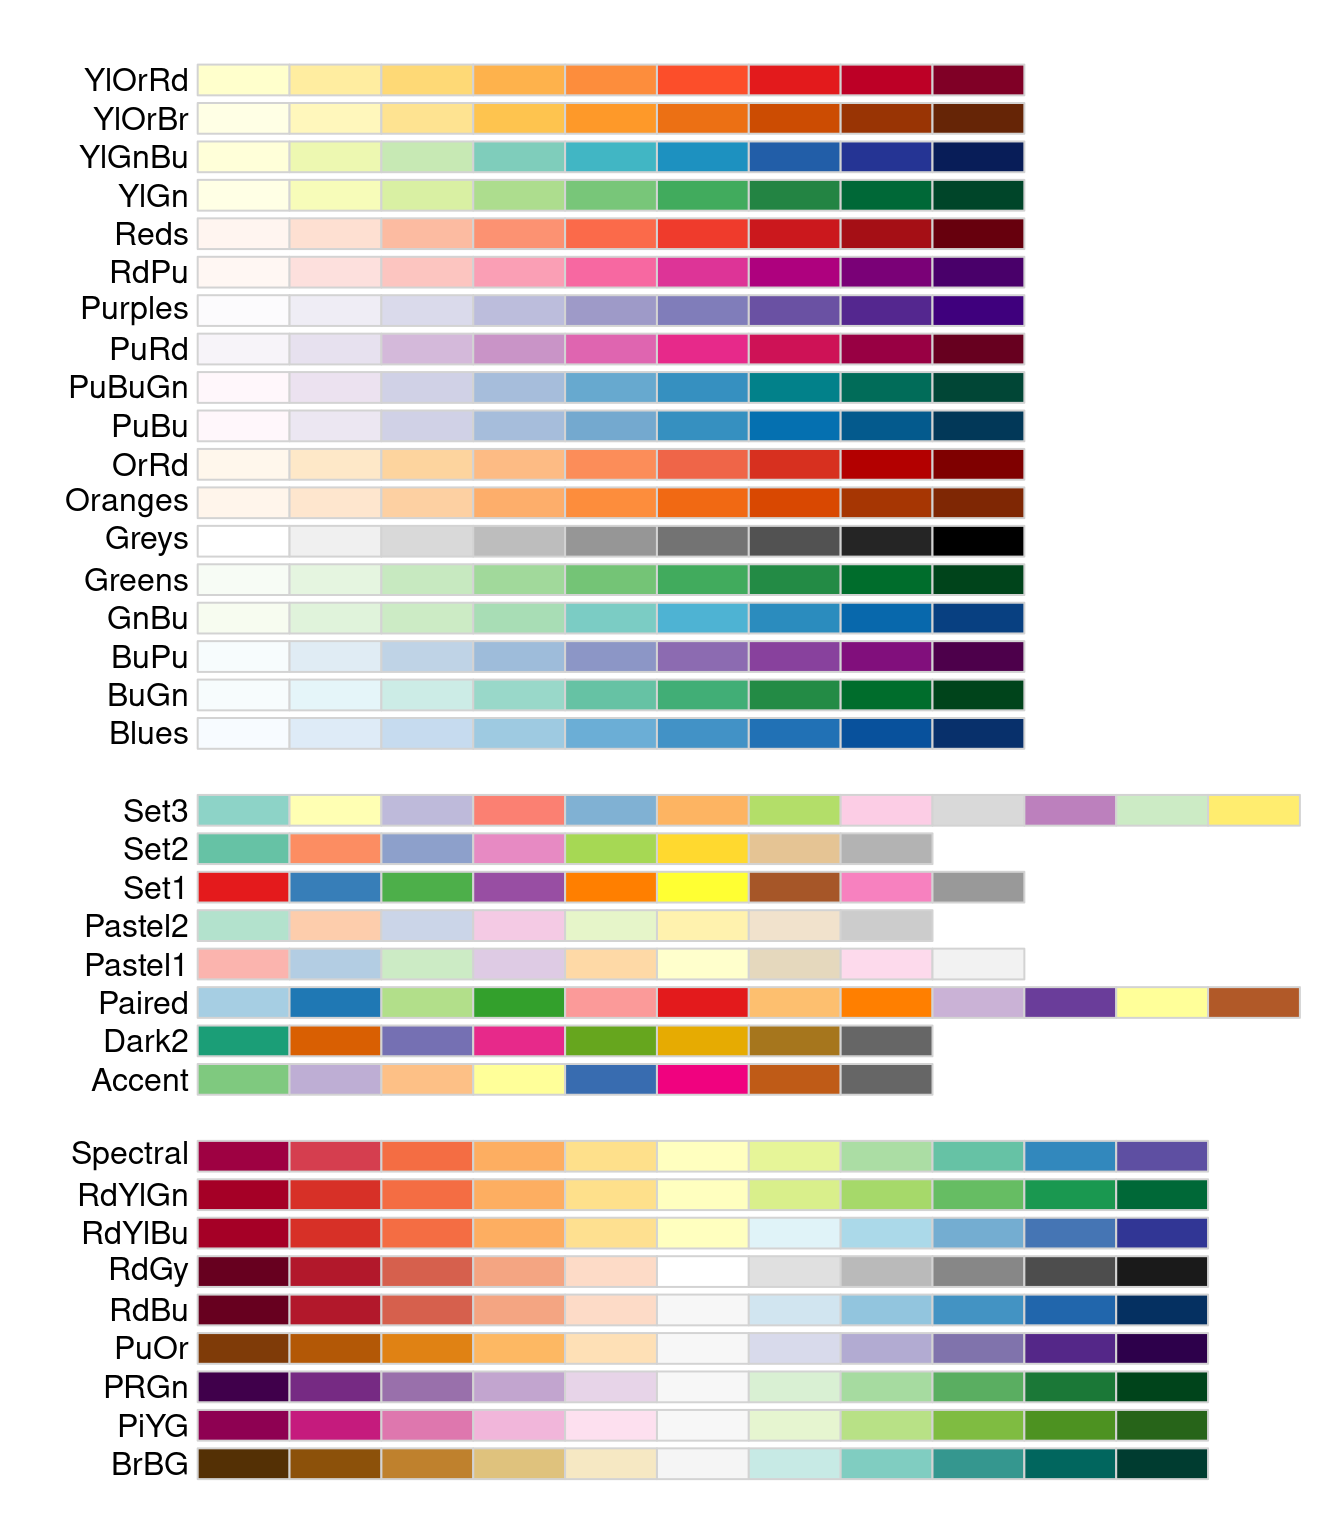
图 11.8: RColorBrewer 调色板
# 代码来自 ?palettes
demo.pal <- function(n, border = if (n < 32) "light gray" else NA,
           main = paste("color palettes: alpha = 1,  n=", n),
           ch.col = c(
             "rainbow(n, start=.7, end=.1)", "heat.colors(n)",
             "terrain.colors(n)", "topo.colors(n)",
             "cm.colors(n)", "gray.colors(n, start = 0.3, end = 0.9)"
           )) {
    nt <- length(ch.col)
    i <- 1:n
    j <- n / nt
    d <- j / 6
    dy <- 2 * d
    plot(i, i + d, type = "n", axes = FALSE, ylab = "", xlab = "", main = main)
    for (k in 1:nt) {
      rect(i - .5, (k - 1) * j + dy, i + .4, k * j,
        col = eval(parse(text = ch.col[k])), border = border
      )
      text(2 * j, k * j + dy / 4, ch.col[k])
    }
  }
n <- if (.Device == "postscript") 64 else 16
# Since for screen, larger n may give color allocation problem
par(mar = c(0, 0, 2, 0))
demo.pal(n)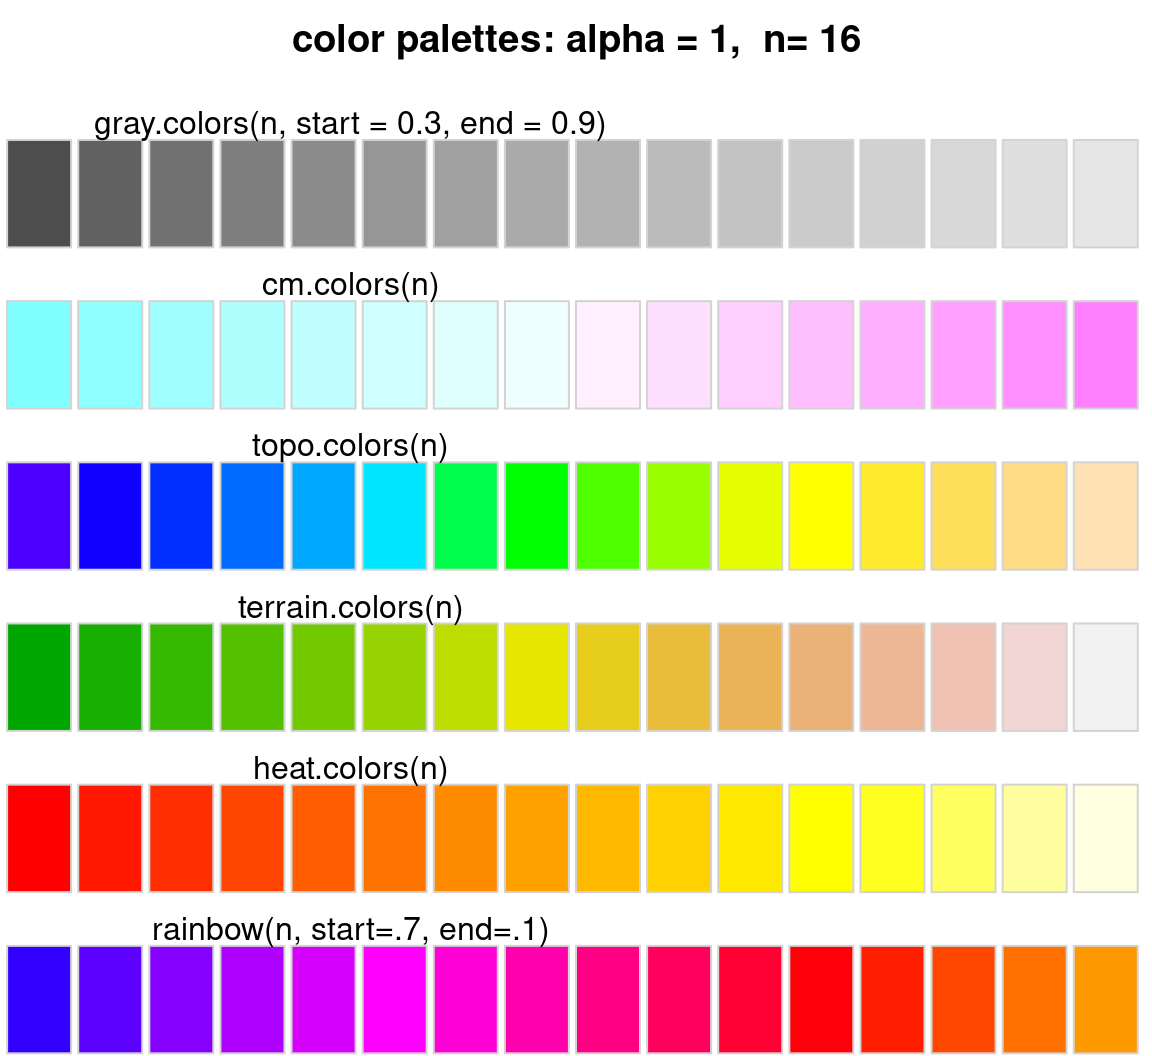
图 11.9: grDevices 调色板
par(mfrow = c(33, 1), mar = c(0, 0, .8, 0))
for (i in seq(32)) {
  pal(
    n = length((1 + 20 * (i - 1)):(20 * i)),
    colors()[(1 + 20 * (i - 1)):(20 * i)],
    main = paste(1 + 20 * (i - 1), "to", 20 * i)
  )
}
pal(n = 17, colors()[641:657], main = "641 to 657")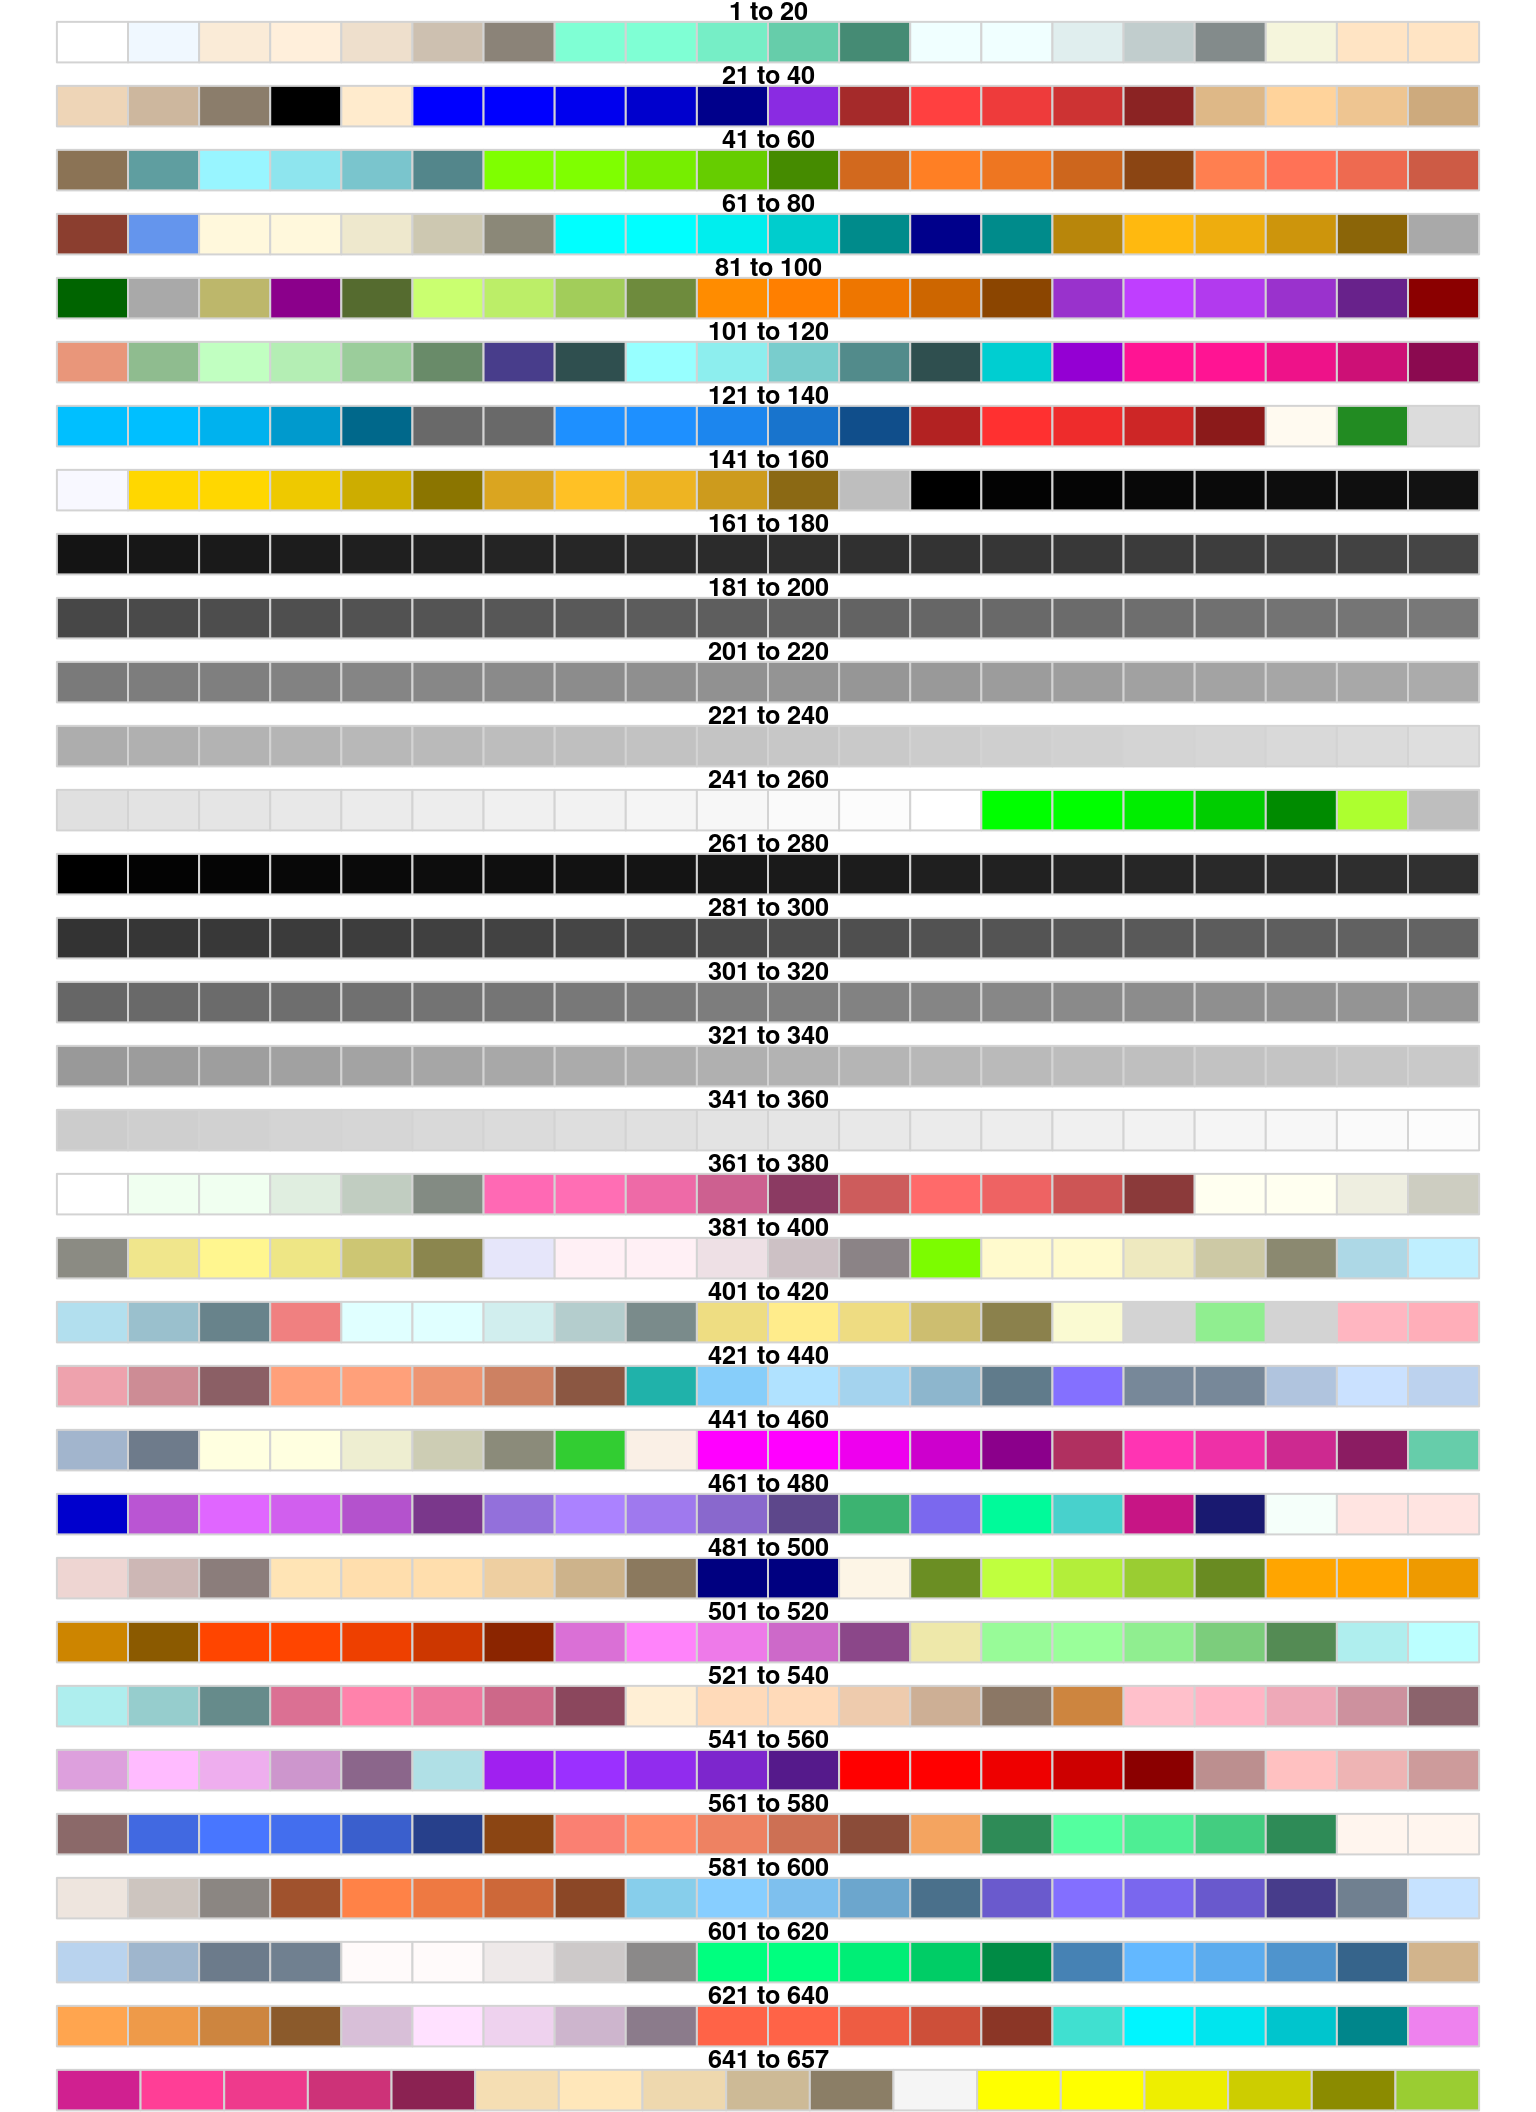
图 11.10: grDevices 调色板
library(colorspace)
## a few useful diverging HCL palettes
par(mar = c(0,0,2,0), mfrow = c(16, 2))

pal(n = 16, diverge_hcl(16), main = "diverging HCL palettes")
pal(n = 16, diverge_hcl(16, h = c(246, 40), c = 96, l = c(65, 90)))
pal(n = 16, diverge_hcl(16, h = c(130, 43), c = 100, l = c(70, 90)))
pal(n = 16, diverge_hcl(16, h = c(180, 70), c = 70, l = c(90, 95)))

pal(n = 16, diverge_hcl(16, h = c(180, 330), c = 59, l = c(75, 95)))
pal(n = 16, diverge_hcl(16, h = c(128, 330), c = 98, l = c(65, 90)))
pal(n = 16, diverge_hcl(16, h = c(255, 330), l = c(40, 90)))
pal(n = 16, diverge_hcl(16, c = 100, l = c(50, 90), power = 1))

## sequential palettes
pal(n = 16, sequential_hcl(16), main= "sequential palettes")
pal(n = 16, heat_hcl(16, h = c(0, -100),
                     l = c(75, 40), c = c(40, 80), power = 1))
pal(n = 16, terrain_hcl(16, c = c(65, 0), l = c(45, 95), power = c(1/3, 1.5)))
pal(n = 16, heat_hcl(16, c = c(80, 30), l = c(30, 90), power = c(1/5, 1.5)))

## compare base and colorspace palettes
## (in color and desaturated)
## diverging red-blue colors
pal(n = 16, diverge_hsv(16), main = "diverging red-blue colors")
pal(n = 16, diverge_hcl(16, c = 100, l = c(50, 90)))
pal(n = 16, desaturate(diverge_hsv(16)))
pal(n = 16, desaturate(diverge_hcl(16, c = 100, l = c(50, 90))))

## diverging cyan-magenta colors
pal(n = 16, cm.colors(16), main = "diverging cyan-magenta colors")
pal(n = 16, diverge_hcl(16, h = c(180, 330), c = 59, l = c(75, 95)))
pal(n = 16, desaturate(cm.colors(16)))
pal(n = 16, desaturate(diverge_hcl(16, h = c(180, 330), c = 59, l = c(75, 95))))

## heat colors
pal(n = 16, heat.colors(16), main = "heat colors")
pal(n = 16, heat_hcl(16))
pal(n = 16, desaturate(heat.colors(16)))
pal(n = 16, desaturate(heat_hcl(16)))

## terrain colors
pal(n = 16, terrain.colors(16), main = "terrain colors")
pal(n = 16, terrain_hcl(16))
pal(n = 16, desaturate(terrain.colors(16)))
pal(n = 16, desaturate(terrain_hcl(16)))

pal(n = 16, rainbow_hcl(16, start = 30, end = 300), main = "dynamic")
pal(n = 16, rainbow_hcl(16, start = 60, end = 240), main = "harmonic")
pal(n = 16, rainbow_hcl(16, start = 270, end = 150), main = "cold")
pal(n = 16, rainbow_hcl(16, start = 90, end = -30), main = "warm")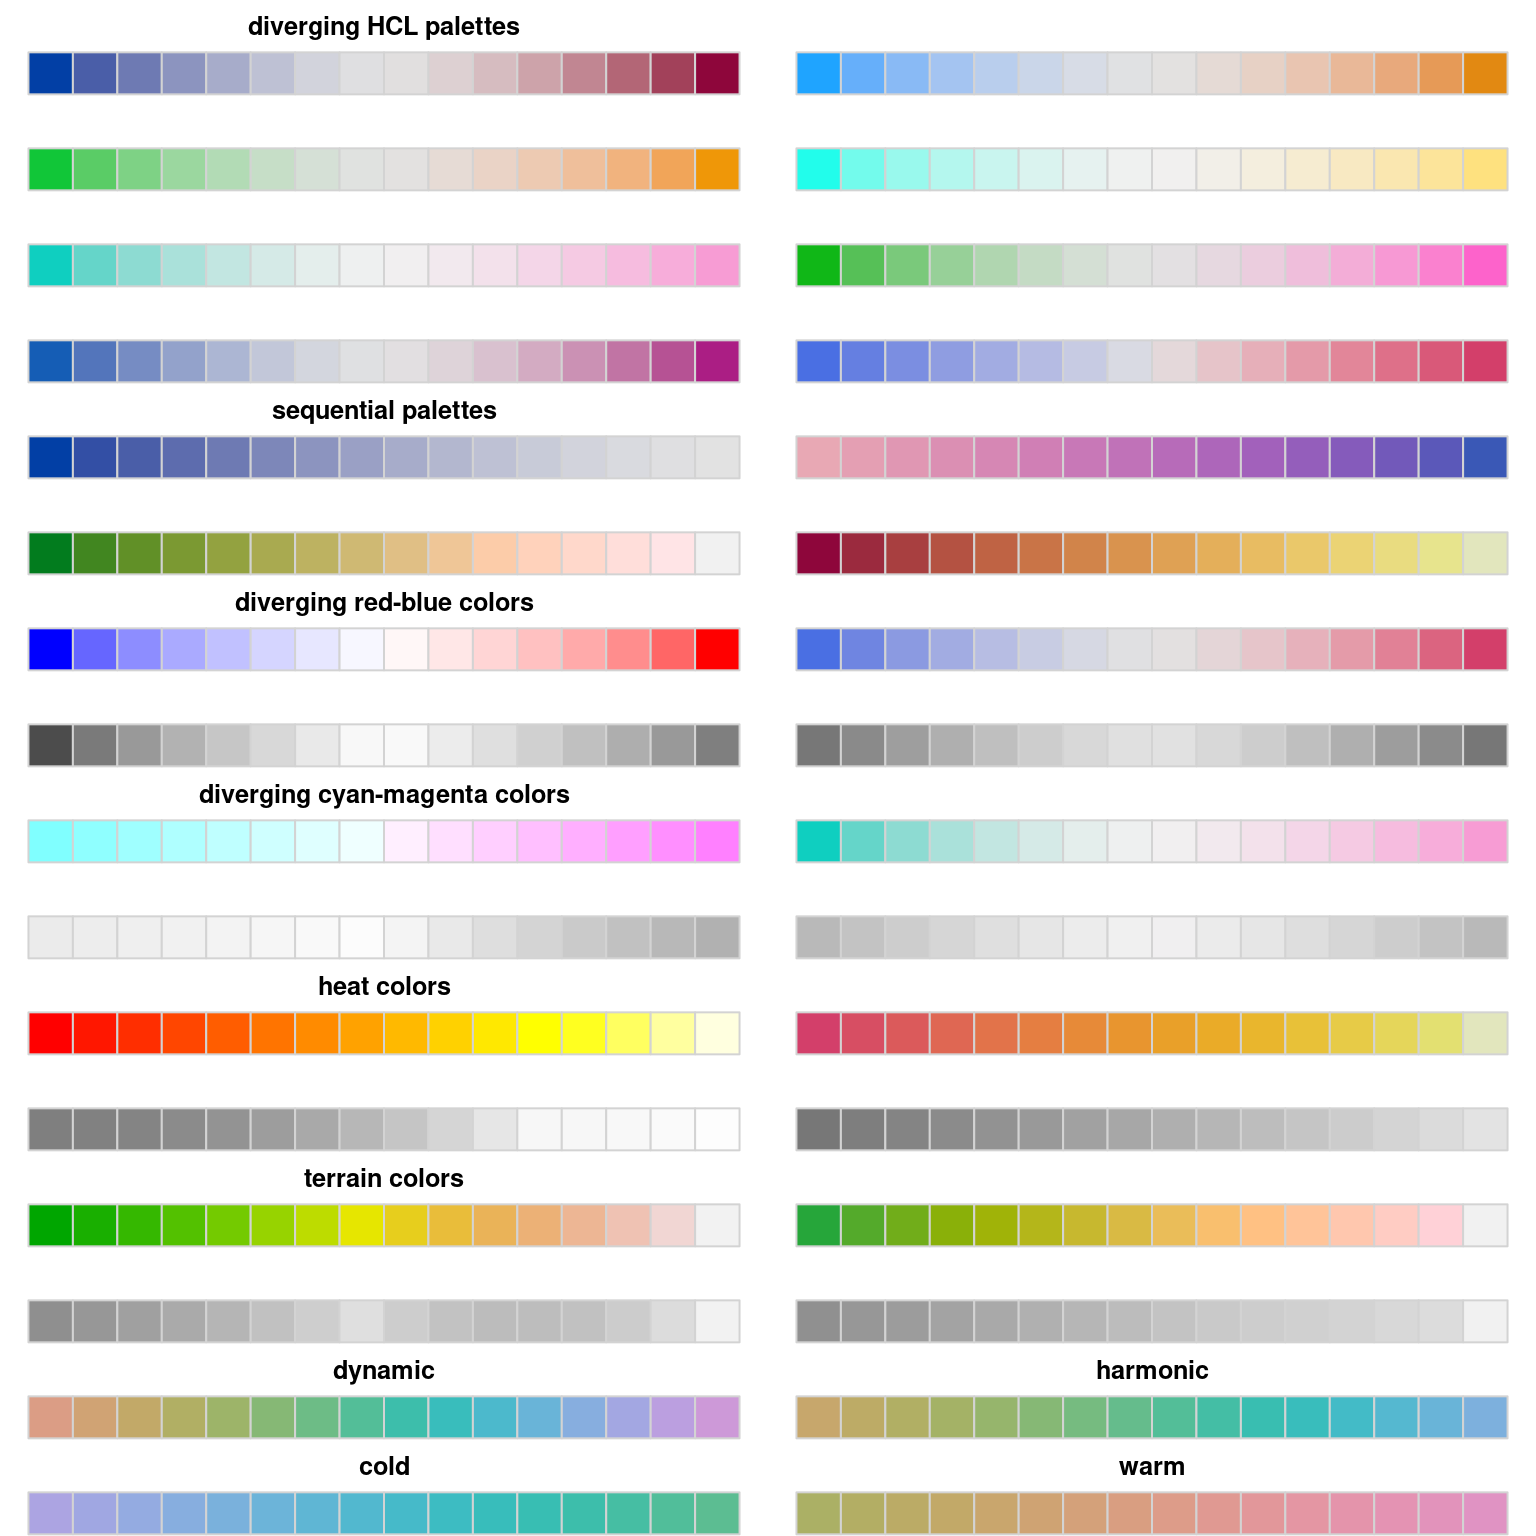
图 11.11: colorspace 调色板
除之前提到的 grDevices 包, colorspace (https://hclwizard.org/) 包 [15]–[17],RColorBrewer 包 [18] https://colorbrewer2.org/,viridis 包、colourvalues、wesanderson、dichromat 包、pals 包,palr 包,colorRamps 包、ColorPalette 包、colortools 包就不一一详细介绍了。
colormap 包基于 node.js 的 colormap 模块提供 44 个预定义的调色板 paletteer 包收集了很多 R 包提供的调色板,同时也引入了很多依赖。根据电影 Harry Potter 制作的调色板 harrypotter,根据网站 CARTO 设计的 rcartocolor 包,colorblindr 模拟色盲环境下的配色方案。
yarrr 包主要是为书籍 《YaRrr! The Pirate’s Guide to R》 https://github.com/ndphillips/ThePiratesGuideToR 提供配套资源,兼顾收集了一组调色板。
RColorBrewer 调色板数量必须至少 3 个,这是上游 colorbrewer 的 问题,具体体现在调用
RColorBrewer::brewer.pal(n = 2, name = "Set2") 时会有警告。 plotly 调用
[1] "#66C2A5" "#FC8D62" "#8DA0CB"
Warning message:
In RColorBrewer::brewer.pal(n = 2, name = "Set2") :
minimal value for n is 3, returning requested palette with 3 different levelspar(mar = c(1, 2, 1, 0), mfrow = c(3, 2))
set.seed(1234)
x <- sample(seq(8), 8, replace = FALSE)
barplot(x, col = palette(), border = "white")
barplot(x, col = heat.colors(8), border = "white")
barplot(x, col = gray.colors(8), border = "white")
barplot(x, col = "lightblue", border = "white")
barplot(x, col = colorspace::sequential_hcl(8), border = "white")
barplot(x, col = colorspace::diverge_hcl(8,
h = c(130, 43),
c = 100, l = c(70, 90)
), border = "white")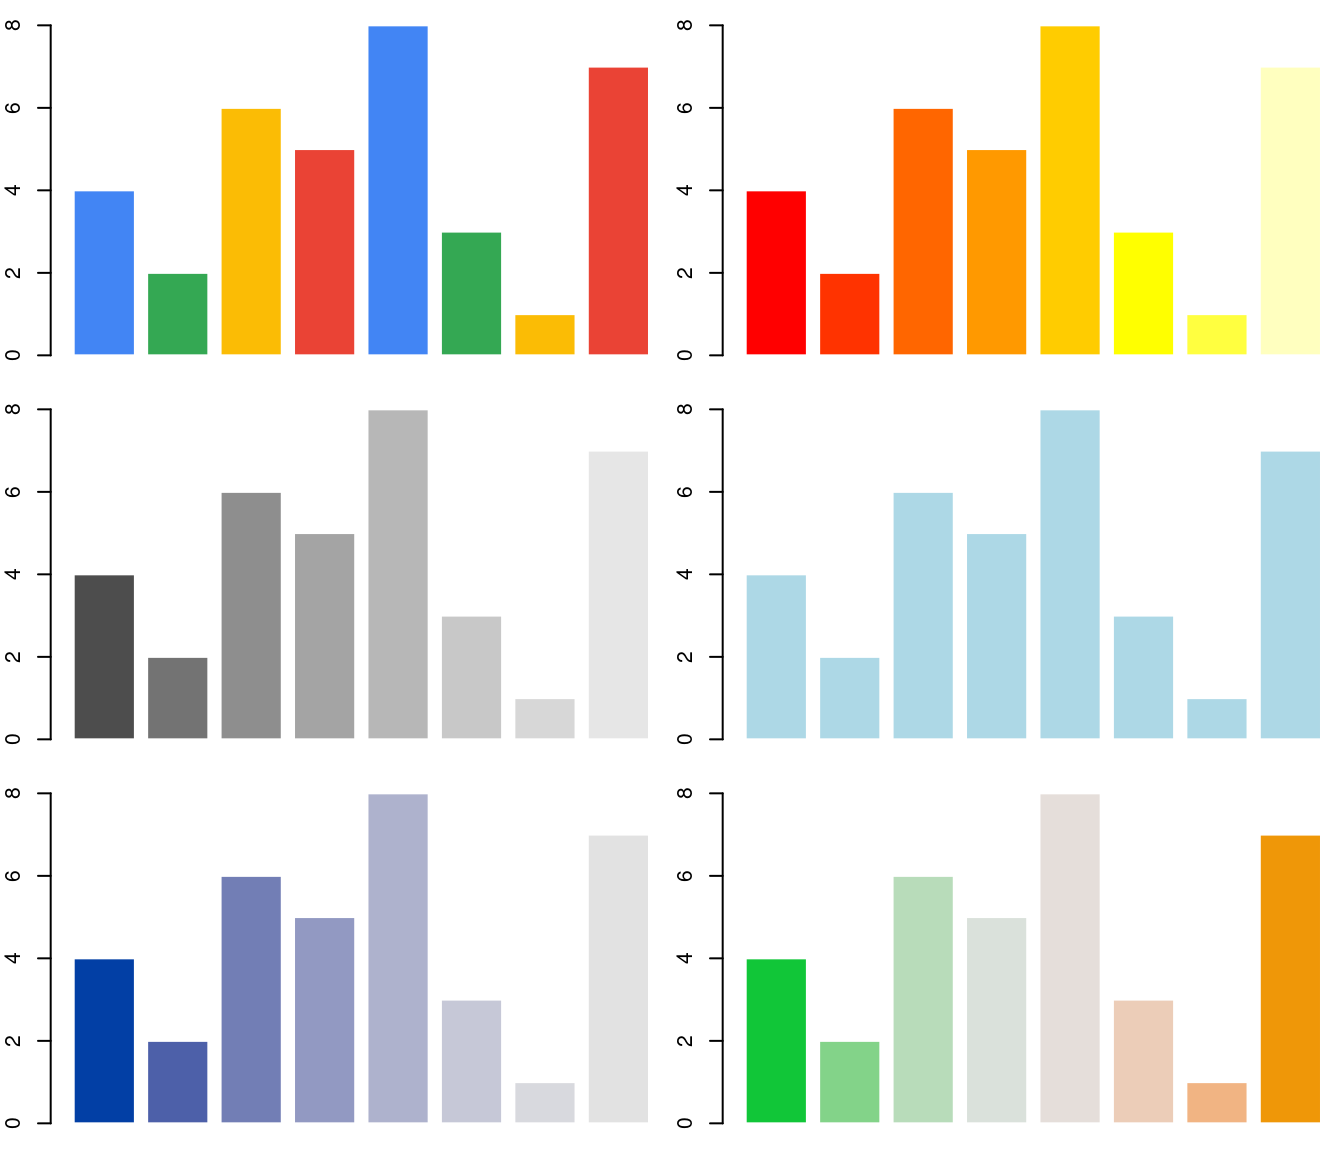
图 11.12: 源起
与图 12.53 对比,图11.13 的层次更加丰富,识别性更高
expand.grid(months = month.abb, years = 1949:1960) |>
  transform(num = as.vector(AirPassengers)) |>
  ggplot(aes(x = years, y = months, fill = num)) +
  scale_fill_distiller(palette = "Spectral") +
  geom_tile(color = "white", size = 0.4) +
  scale_x_continuous(
    expand = c(0.01, 0.01),
    breaks = seq(1949, 1960, by = 1),
    labels = 1949:1960
  ) +
  theme_minimal(
    base_size = 10.54,
    base_family = "Noto Serif CJK SC"
  ) +
  labs(x = "年", y = "月", fill = "人数")
## Warning: Using `size` aesthetic for lines was deprecated in ggplot2 3.4.0.
## ℹ Please use `linewidth` instead.
## This warning is displayed once every 8 hours.
## Call `lifecycle::last_lifecycle_warnings()` to see where this warning was
## generated.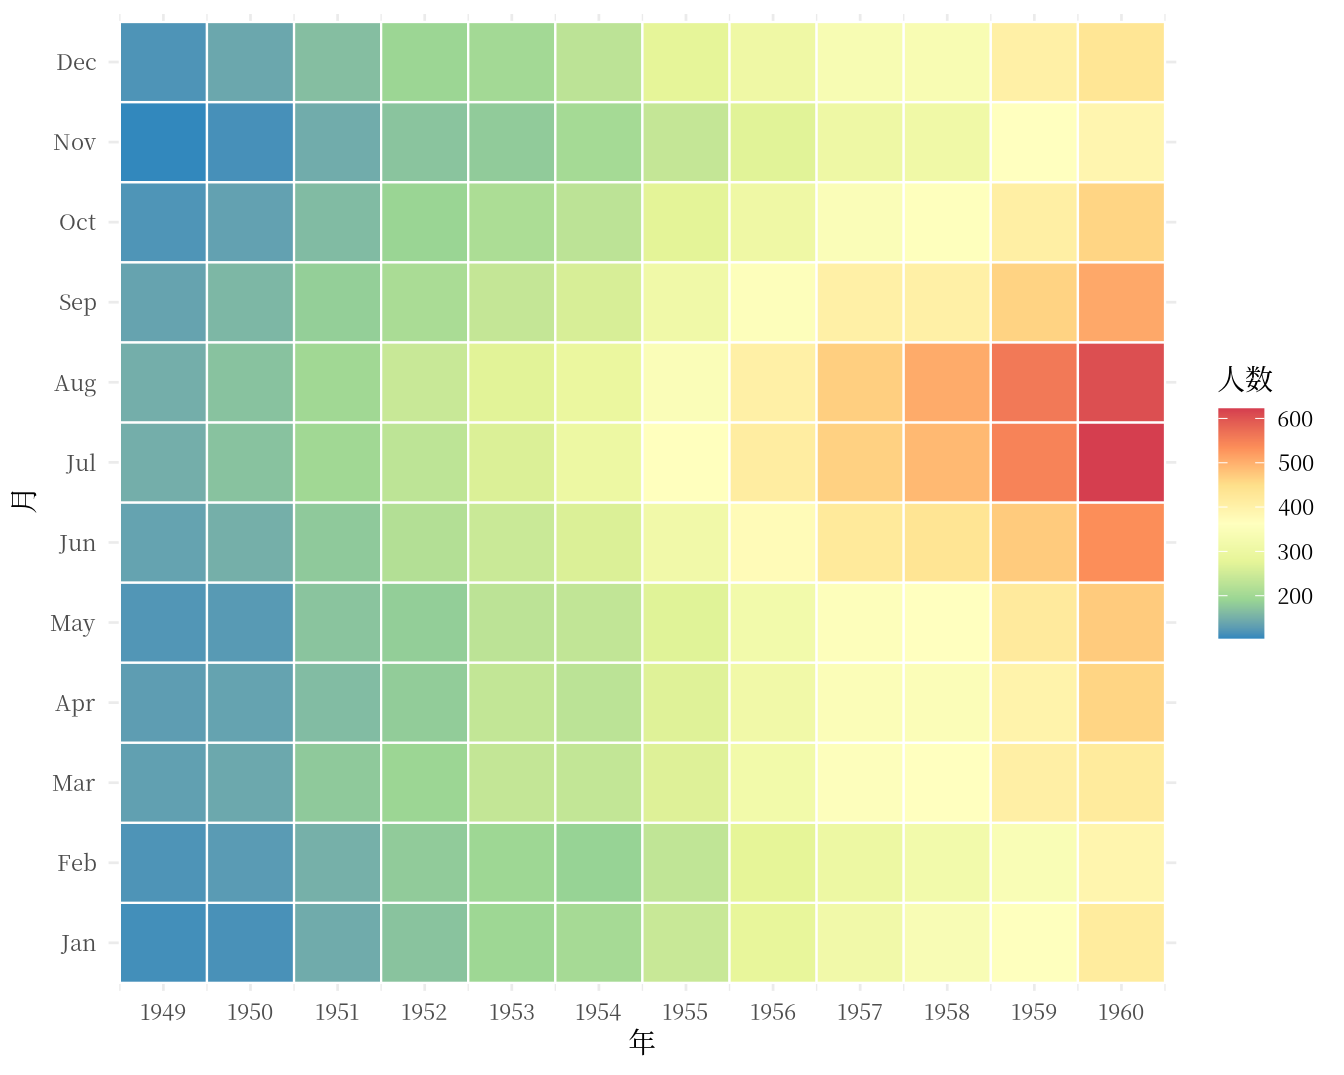
图 11.13: Spectral 调色板
再举例子,图 11.14 是正负例对比,其中好在哪里呢?这张图要表达美国黄石国家公园的老忠实泉间歇喷发的时间规律,那么好的标准就是层次分明,以突出不同颜色之间的时间差异。这个差异,还要看起来不那么费眼睛,一目了然最好。
erupt <- ggplot(faithfuld, aes(waiting, eruptions, fill = density)) +
  geom_raster() +
  scale_x_continuous(NULL, expand = c(0, 0)) +
  scale_y_continuous(NULL, expand = c(0, 0)) +
  theme(legend.position = "none")
p1 <- erupt + scale_fill_gradientn(colours = gray.colors(7))
p2 <- erupt + scale_fill_distiller(palette = "Spectral")
p3 <- erupt + scale_fill_gradientn(colours = terrain.colors(7))
p4 <- erupt + scale_fill_continuous(type = 'viridis')
(p1 + p2) / (p3 + p4)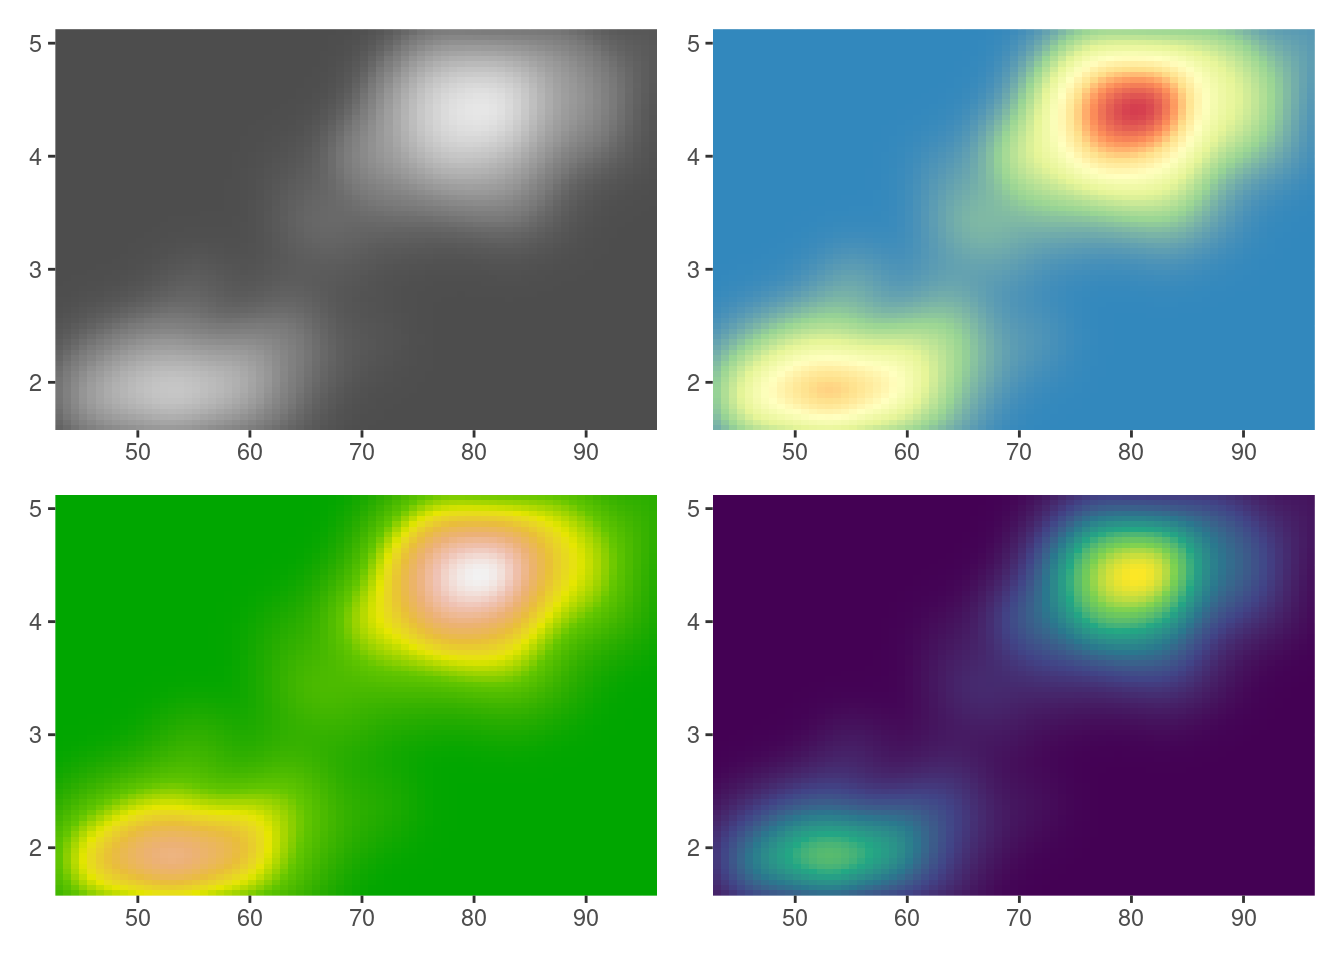
图 11.14: 美国黄石国家公园的老忠实泉
RColorBrewer 包 提供了有序 (Sequential) 、定性 (Qualitative) 和发散 (Diverging) 三类调色板,一般来讲,分别适用于连续或有序分类变量、无序分类变量、两类分层对比变量的绘图。再加上强大的 ggplot2 包内置的对颜色处理的函数,如 scale_alpha_* 、 scale_colour_* 和 scale_fill_* 等,详见:
ls("package:ggplot2", pattern = "scale_col(ou|o)r_")## [1] "scale_color_binned" "scale_color_brewer"
## [3] "scale_color_continuous" "scale_color_date"
## [5] "scale_color_datetime" "scale_color_discrete"
## [7] "scale_color_distiller" "scale_color_fermenter"
## [9] "scale_color_gradient" "scale_color_gradient2"
## [11] "scale_color_gradientn" "scale_color_grey"
## [13] "scale_color_hue" "scale_color_identity"
## [15] "scale_color_manual" "scale_color_ordinal"
## [17] "scale_color_steps" "scale_color_steps2"
## [19] "scale_color_stepsn" "scale_color_viridis_b"
## [21] "scale_color_viridis_c" "scale_color_viridis_d"
## [23] "scale_colour_binned" "scale_colour_brewer"
## [25] "scale_colour_continuous" "scale_colour_date"
## [27] "scale_colour_datetime" "scale_colour_discrete"
## [29] "scale_colour_distiller" "scale_colour_fermenter"
## [31] "scale_colour_gradient" "scale_colour_gradient2"
## [33] "scale_colour_gradientn" "scale_colour_grey"
## [35] "scale_colour_hue" "scale_colour_identity"
## [37] "scale_colour_manual" "scale_colour_ordinal"
## [39] "scale_colour_steps" "scale_colour_steps2"
## [41] "scale_colour_stepsn" "scale_colour_viridis_b"
## [43] "scale_colour_viridis_c" "scale_colour_viridis_d"ls("package:ggplot2", pattern = "scale_fill_")## [1] "scale_fill_binned" "scale_fill_brewer" "scale_fill_continuous"
## [4] "scale_fill_date" "scale_fill_datetime" "scale_fill_discrete"
## [7] "scale_fill_distiller" "scale_fill_fermenter" "scale_fill_gradient"
## [10] "scale_fill_gradient2" "scale_fill_gradientn" "scale_fill_grey"
## [13] "scale_fill_hue" "scale_fill_identity" "scale_fill_manual"
## [16] "scale_fill_ordinal" "scale_fill_steps" "scale_fill_steps2"
## [19] "scale_fill_stepsn" "scale_fill_viridis_b" "scale_fill_viridis_c"
## [22] "scale_fill_viridis_d"colourlovers 包借助 XML, jsonlite 和 httr 包可以在线获取网站 COLOURlovers 的调色板
library(colourlovers)
palette1 <- clpalette('113451')
palette2 <- clpalette('92095')
palette3 <- clpalette('629637')
palette4 <- clpalette('694737')
使用调色板
layout(matrix(1:4, nrow = 2))
par(mar = c(2, 2, 2, 2))

barplot(VADeaths, col = swatch(palette1)[[1]], border = NA)
barplot(VADeaths, col = swatch(palette2)[[1]], border = NA)
barplot(VADeaths, col = swatch(palette3)[[1]], border = NA)
barplot(VADeaths, col = swatch(palette4)[[1]], border = NA)
调色板的描述信息
palette1获取调色板中的颜色向量
swatch(palette1)[[1]]