12.30 龙卷风图
dat <- data.frame(
  variable = c("A", "B", "A", "B"),
  Level = c("Top-2", "Top-2", "Bottom-2", "Bottom-2"),
  value = c(.8, .7, -.2, -.3)
)
ggplot(dat, aes(x = variable, y = value, fill = Level)) +
  geom_bar(position = "identity", stat = "identity") +
  scale_y_continuous(labels = abs) +
  coord_flip() +
  theme_minimal()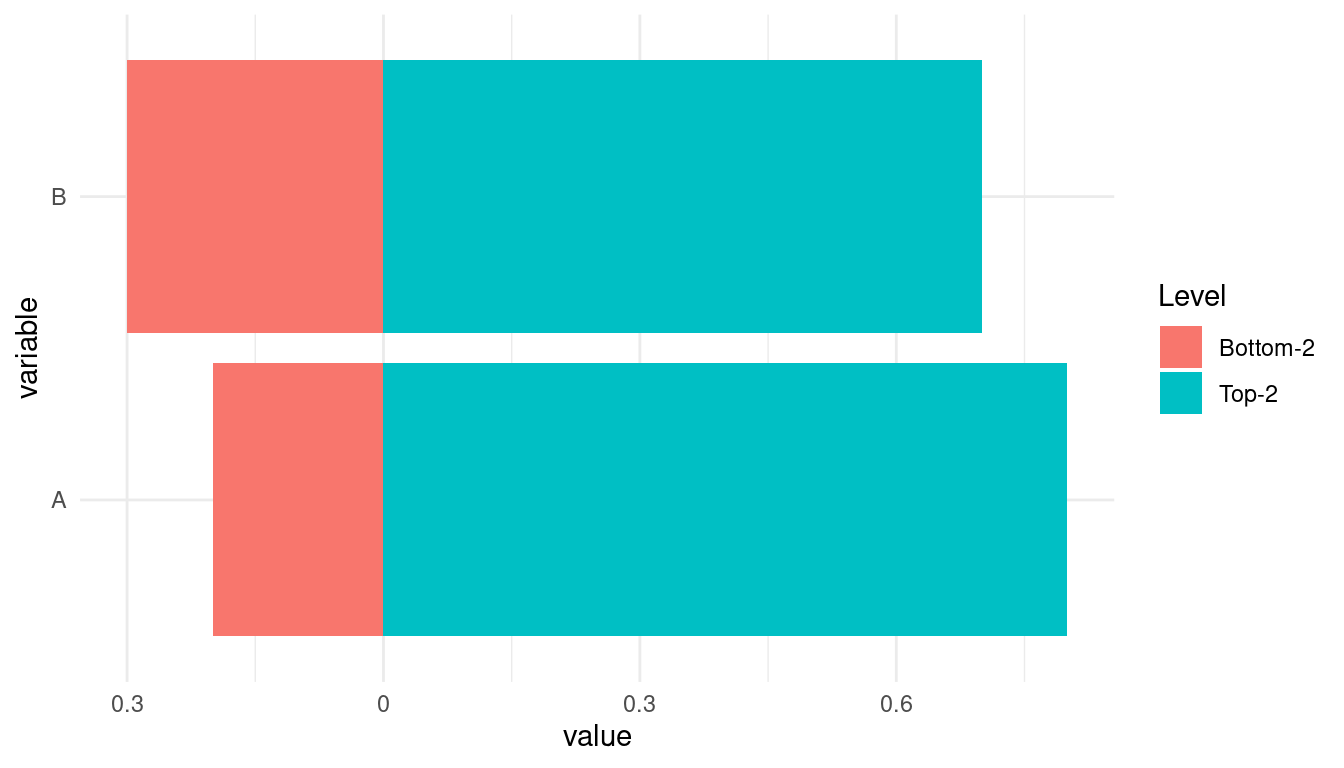
图 12.69: 龙卷风图展示变量重要性
Tornado diagram 主要用于敏感性分析,比较不同变量的重要性程度。条形图 geom_bar() 图层的变体,模型权重可视化的手段,仅限于广义线性模型。