12.2 地图
USArrests 数据集描述了1973年美国50个州每10万居民中因袭击、抢劫和强奸而逮捕的人,以及城市人口占比。这里的地图是指按照行政区划为边界的示意图,比如图 12.3
library(maps)
crimes <- data.frame(state = tolower(rownames(USArrests)), USArrests)
# 等价于 crimes %>% tidyr::pivot_longer(Murder:Rape)
vars <- lapply(names(crimes)[-1], function(j) {
  data.frame(state = crimes$state, variable = j, value = crimes[[j]])
})
crimes_long <- do.call("rbind", vars)
states_map <- map_data("state")
ggplot(crimes, aes(map_id = state)) +
  geom_map(aes(fill = Murder), map = states_map) +
  expand_limits(x = states_map$long, y = states_map$lat) +
  scale_fill_binned(type = "viridis") +
  coord_map() +
  theme_minimal()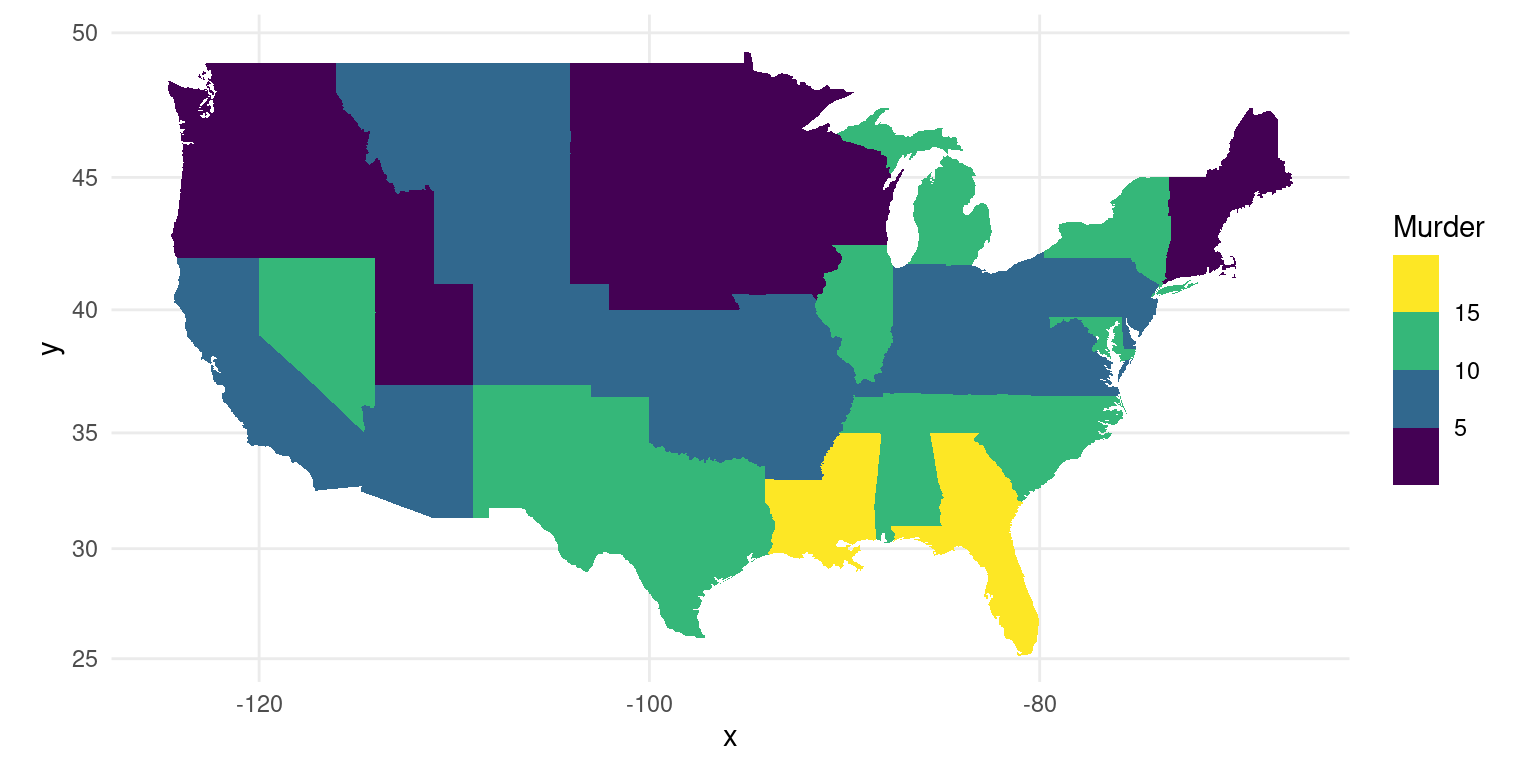
图 12.3: 1975年美国各州犯罪事件
先来看看中国及其周边,见图12.4,这个地图的缺陷就是中国南海及九段线没有标记,台湾和中国大陆不是一种颜色标记,这里的地图数据来自 R 包 maps 和 mapdata,像这样的地图就不宜在国内正式刊物上出现。
library(maps)
library(mapdata)
east_asia <- map_data("worldHires",
  region = c(
    "Japan", "Taiwan", "China",
    "North Korea", "South Korea"
  )
)
ggplot(east_asia, aes(x = long, y = lat, group = group, fill = region)) +
  geom_polygon(colour = "black") +
  scale_fill_brewer(palette = "Set2") +
  coord_map() +
  theme_minimal()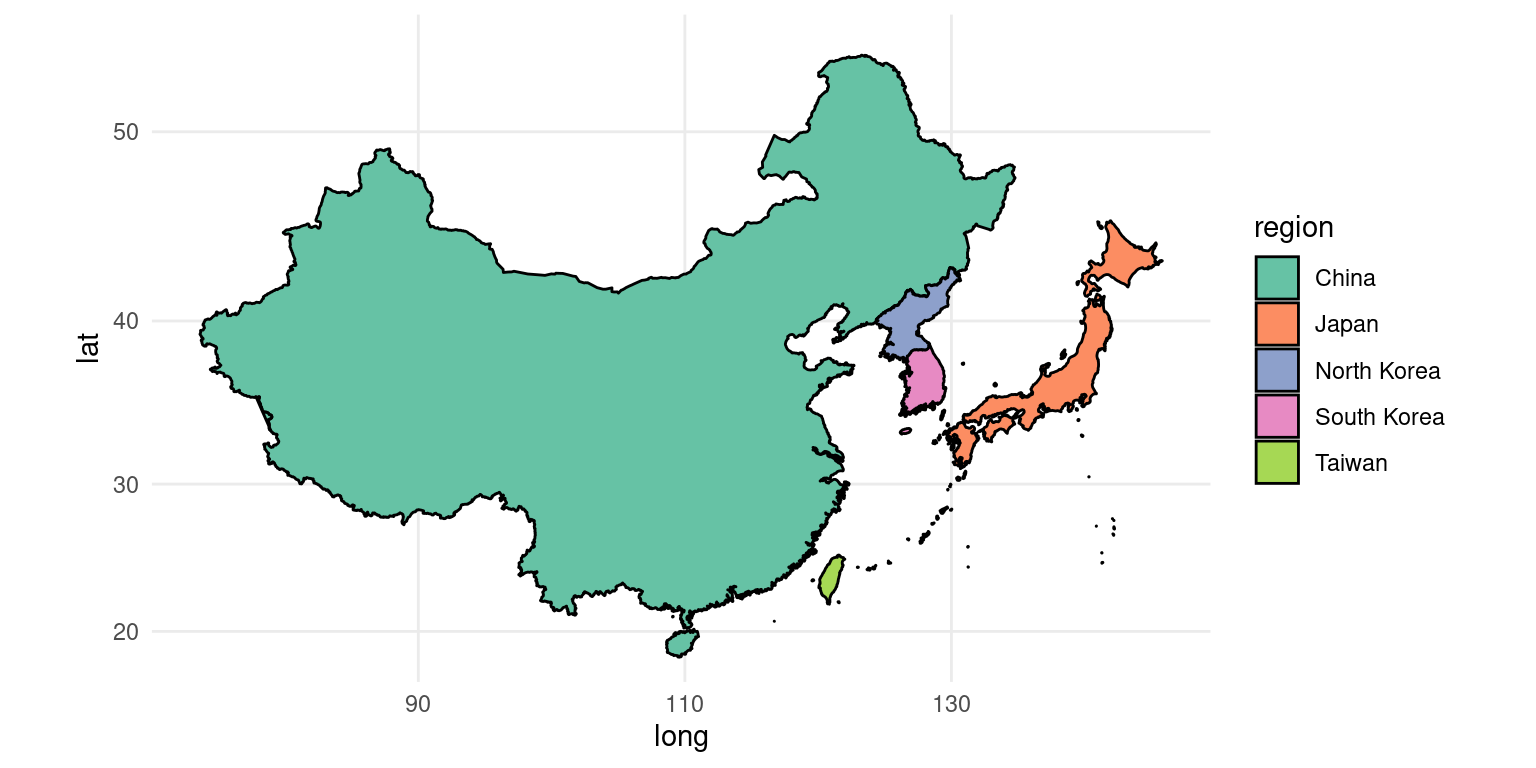
图 12.4: 中国及其周边
绘制真正的地图需要考虑投影坐标系,观察角度、分辨率、政策法规等一系列因素,它是一种复杂的图形,如图 12.5 所示。
worldmap <- map_data("world")

# 默认 mercator 投影下的默认视角 c(90, 0, mean(range(x)))
ggplot(worldmap, aes(long, lat, group = group)) +
  geom_polygon(aes(fill = region), show.legend = FALSE) +
  coord_map(
    xlim = c(-120, 40), ylim = c(30, 90)
  )

# 换观察角度
ggplot(worldmap, aes(long, lat, group = group)) +
  geom_polygon(aes(fill = region), show.legend = FALSE) +
  coord_map(
    xlim = c(-120, 40), ylim = c(30, 90),
    orientation = c(90, 0, 0)
  )

# 换投影坐标系
ggplot(worldmap, aes(long, lat, group = group)) +
  geom_polygon(aes(fill = region), show.legend = FALSE) +
  coord_map("ortho",
    xlim = c(-120, 40), ylim = c(30, 90)
  )

# 二者皆换
ggplot(worldmap, aes(long, lat, group = group)) +
  geom_polygon(aes(fill = region), show.legend = FALSE) +
  coord_map("ortho",
    xlim = c(-120, 40), ylim = c(30, 90),
    orientation = c(90, 0, 0)
  )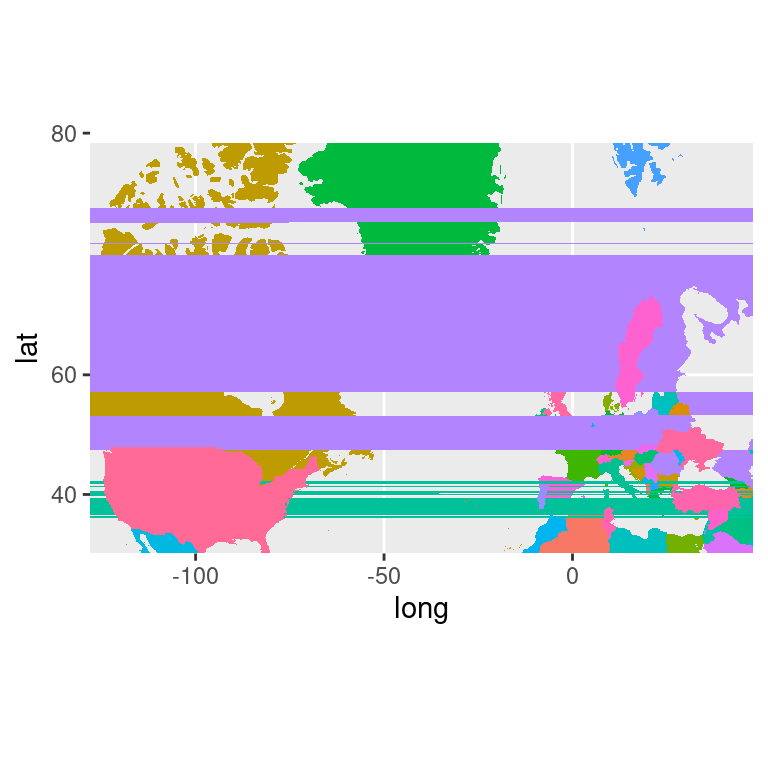
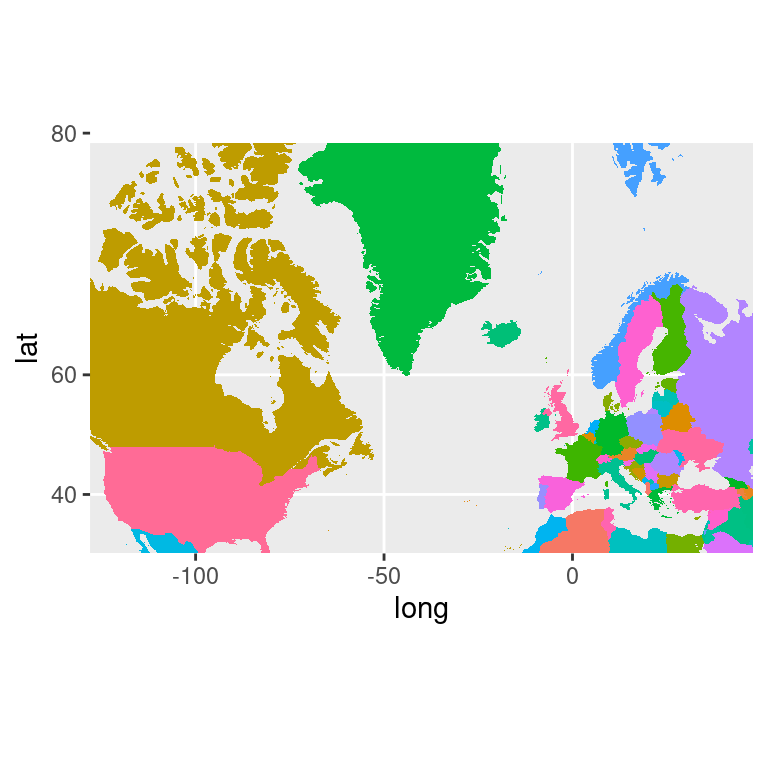
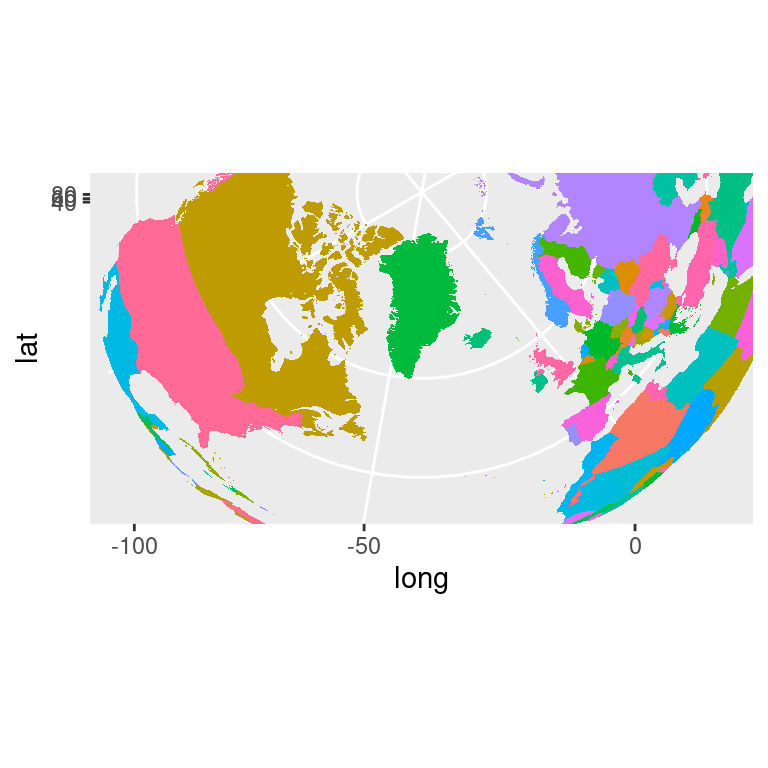
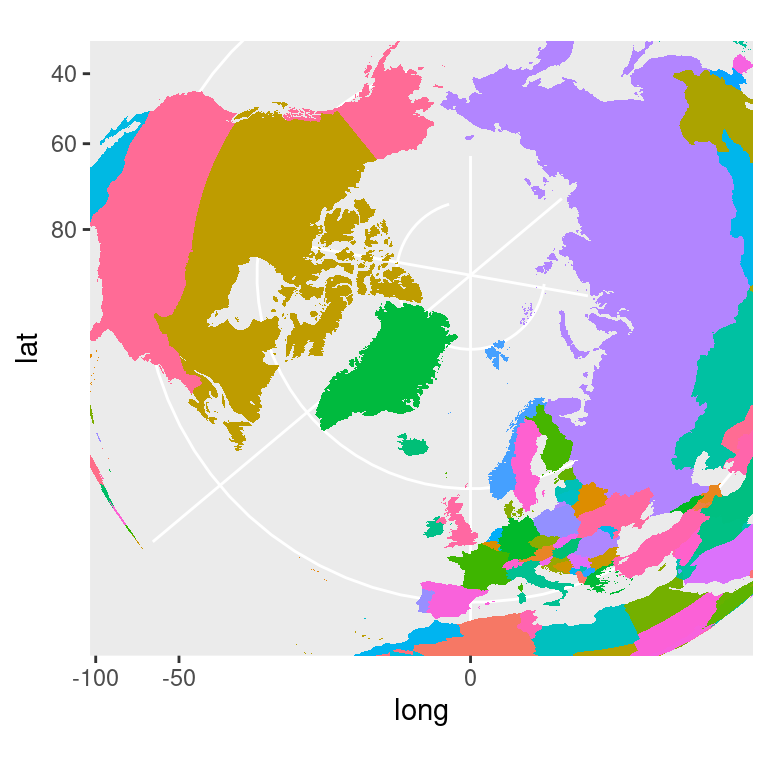
图 12.5: 画地图的正确姿势