10.3 栅格统计图形
If you imagine that this pen is Trellis, then Lattice is not this pen.
— Paul Murrell 30
把网站搬出来,汉化 http://latticeextra.r-forge.r-project.org/
10.3.1 时序图
latticeExtra 包提供了强大的图层函数 layer()
多元时间序列
library(RColorBrewer)
library(latticeExtra)
xyplot(EuStockMarkets) +
  layer(panel.scaleArrow(
    x = 0.99, append = " units", col = "grey", srt = 90, cex = 0.8
  ))
如何解释
10.3.2 水平图
Plot many time series in parallel
horizonplot(EuStockMarkets,
  colorkey = TRUE,
  origin = 4000, horizonscale = 1000
) +
  layer(panel.scaleArrow(
    x = 0.99, digits = 1, col = "grey",
    srt = 90, cex = 0.7
  )) +
  layer(
    lim <- current.panel.limits(),
    panel.text(lim$x[1], lim$y[1], round(lim$y[1], 1),
      font = 2,
      cex = 0.7, adj = c(-0.5, -0.5), col = "#9FC8DC"
    )
  )
10.3.3 折线图
# # https://stackoverflow.com/questions/25109196/r-lattice-package-add-legend-to-a-figure
library(lattice)
library(nlme)

plot(Orange,
  outer = ~1,
  key = list(
    space = "right", title = "Tree", cex.title = 1,
    lines = list(lty = 1, col = gray.colors(5)),
    # points = list(pch = 1, col = gray.colors(5)),
    text = list(c("3", "1", "5", "2", "4"))
  ),
  par.settings = list(
    # plot.line = list(col = gray.colors(5), border = "transparent"),
    # plot.symbol = list(col = gray.colors(5), border = "transparent"),
    strip.background = list(col = "white"),
    strip.border = list(col = "black")
  )
)
library(MASS)
library(lattice)
## Plot the claims frequency against age group by engine size and district

barchart(Claims / Holders ~ Age | Group,
  groups = District,
  data = Insurance, origin = 0, auto.key = TRUE
)
10.3.4 高级设置
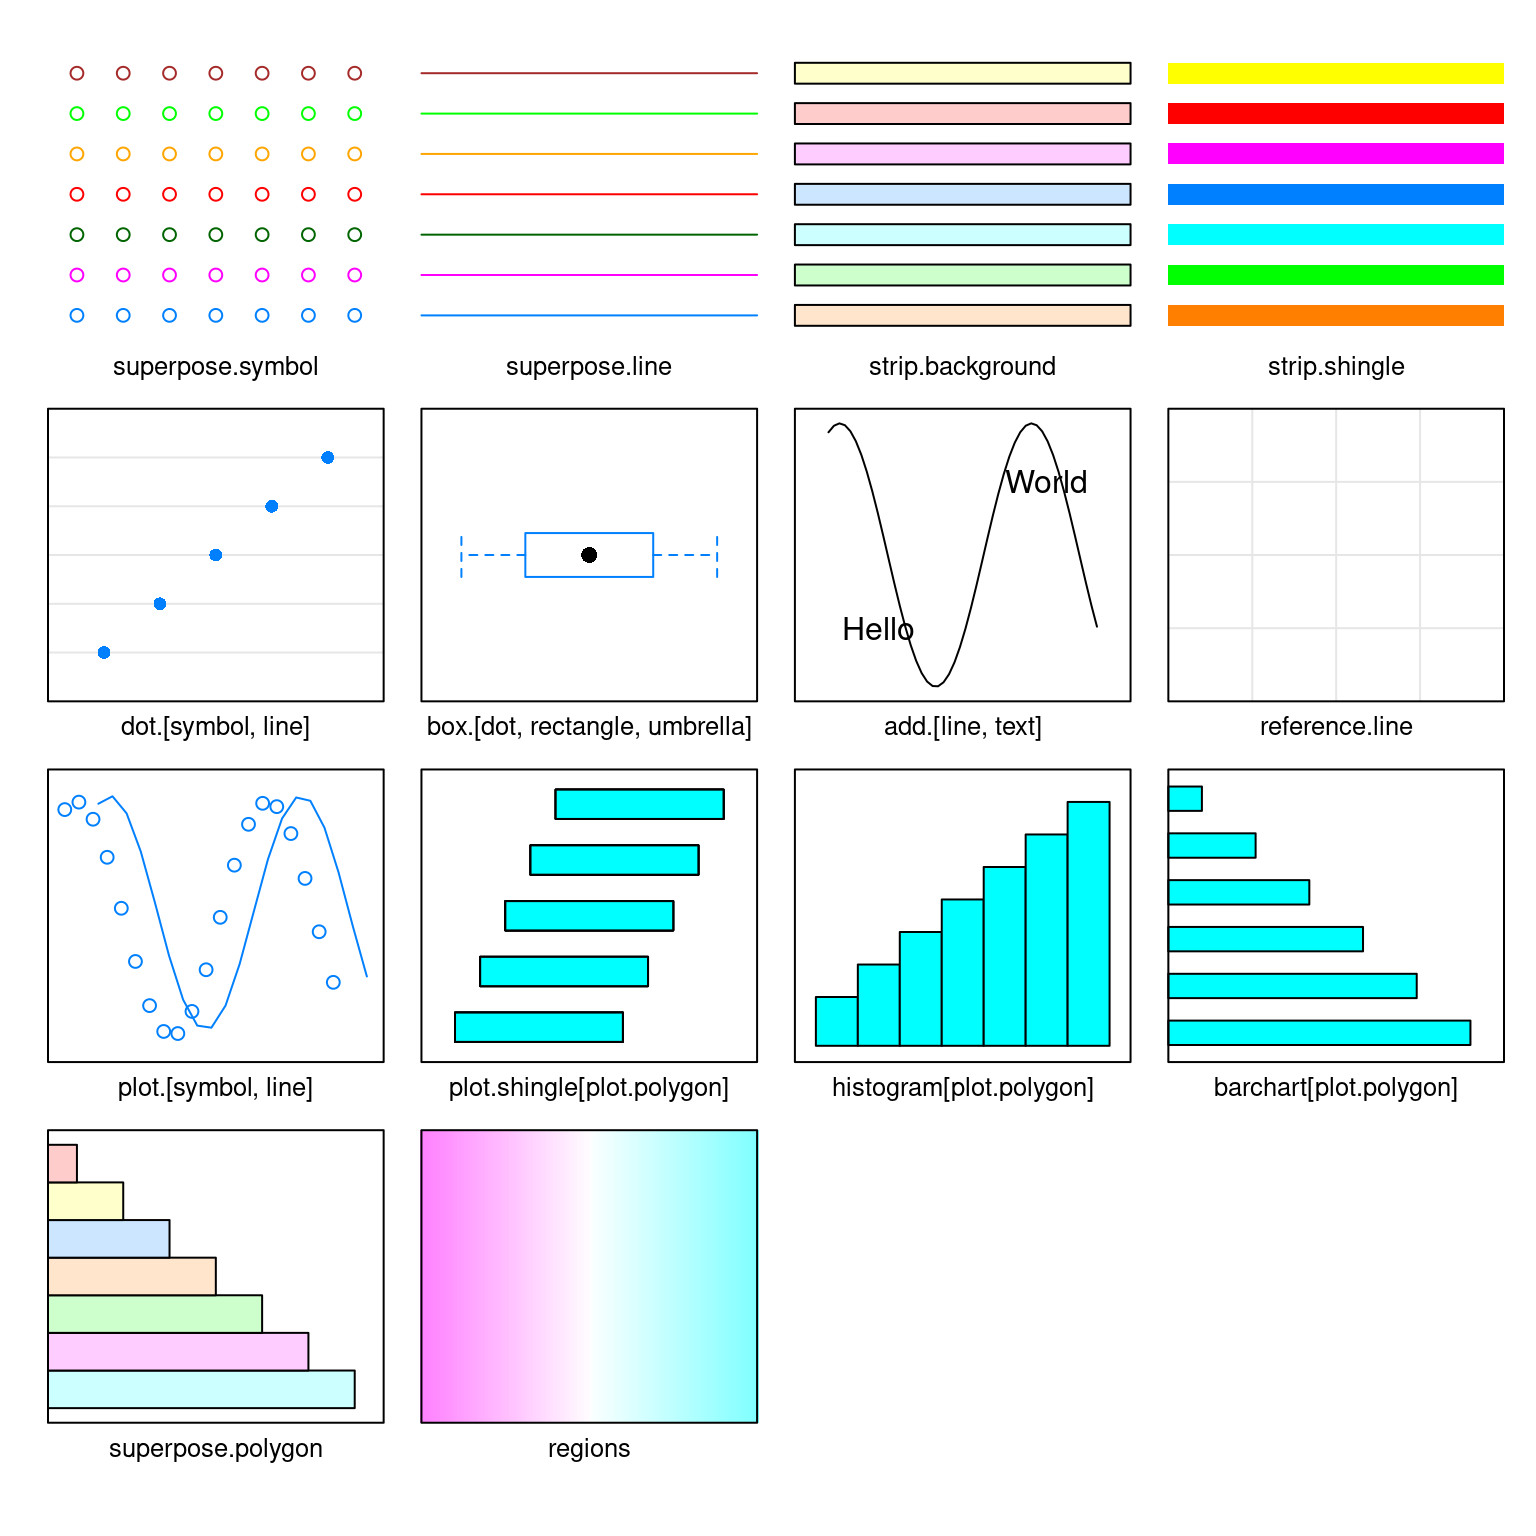
lattice 图形的参数设置
show.settings()
myColours <- brewer.pal(6, "Blues")
my.settings <- list(
  superpose.polygon = list(col = myColours[2:5], border = "transparent"),
  strip.background = list(col = myColours[6]),
  strip.border = list(col = "black")
)

# 获取参数设置
trellis.par.get()

# 全局参数设置
trellis.par.set(my.settings)
10.3.5 柱形图
library(MASS)
library(lattice)

barchart(Claims / Holders * 100 ~ Age | Group,
  groups = District, data = Insurance,
  origin = 0, main = "Motor insurance claims frequency",
  xlab = "Age", ylab = "Claims frequency %",
  scales = list(alternating = 1),
  auto.key = list(
    space = "top", columns = 4,
    points = FALSE, rectangles = TRUE,
    title = "District", cex.title = 1
  ),
  par.settings = list(
    superpose.polygon = list(col = gray.colors(4), border = "transparent"),
    strip.background = list(col = "gray80"),
    strip.border = list(col = "black")
  ),
  par.strip.text = list(col = "gray40", font = 2),
  panel = function(x, y, ...) {
    panel.grid(h = -1, v = 0)
    panel.barchart(x, y, ...)
  }
)
10.3.6 Rootograms
Trellis Displays of Tukey’s Hanging Rootograms
x <- rpois(1000, lambda = 50)
rootogram(~x, dfun = function(x) dpois(x, lambda = 50))
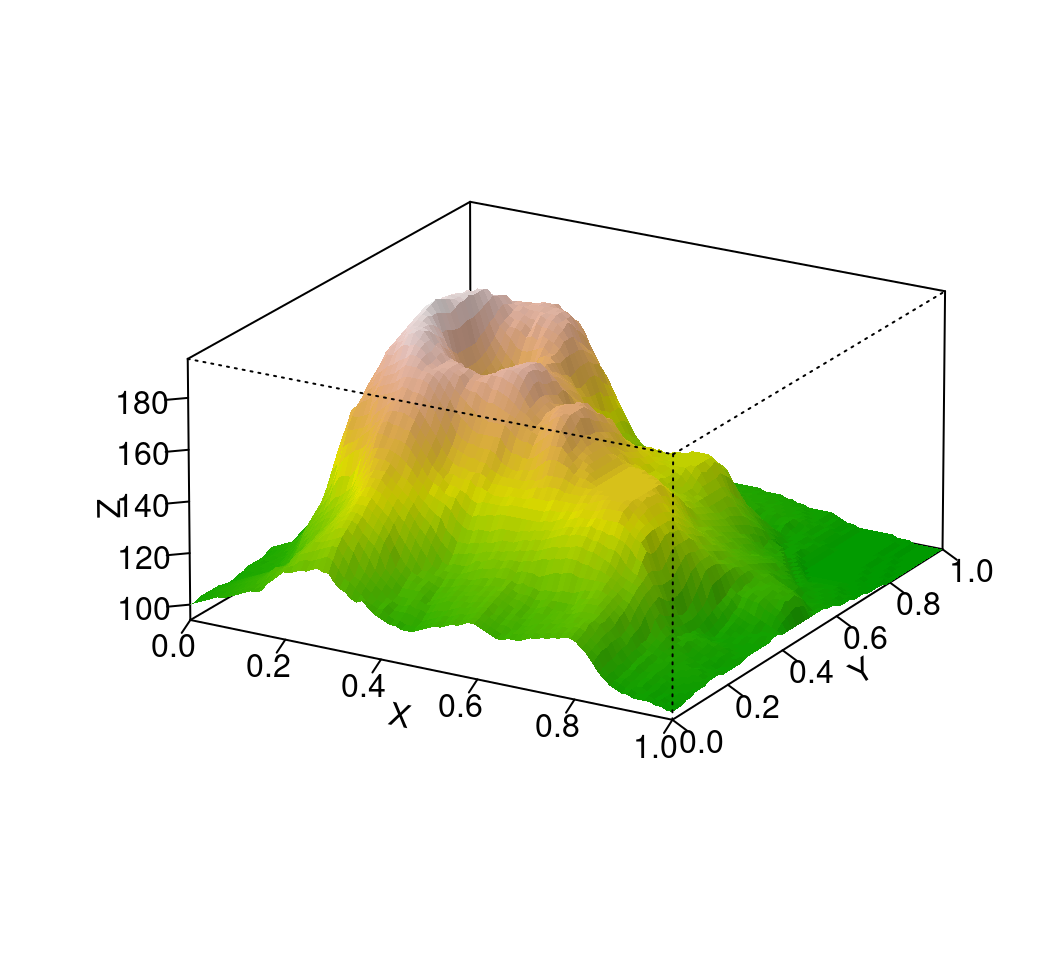
10.3.7 透视图
library(shape)
persp(volcano,
  theta = 30, phi = 20,
  r = 50, d = 0.1, expand = 0.5, ltheta = 90, lphi = 180,
  shade = 0.1, ticktype = "detailed", nticks = 5, box = TRUE,
  col = drapecol(volcano, col = terrain.colors(100)),
  xlab = "X", ylab = "Y", zlab = "Z", border = "transparent"
)
图 10.66: Topographic Information on Auckland’s Maunga Whau Volcano
Paul 在 DSC 2001 大会上的幻灯片 见https://www.stat.auckland.ac.nz/~paul/Talks/dsc2001.pdf↩︎